


Bitcoin, Ripple, Ether, Litecoin - News and Talking Points
- Bitcoin technical breakout sends token 15% - 20% higher.
- A rising tide floats all boats – Ether, Ripple and Litecoin jump.
To see how retail traders are currently positioned in cryptocurrencies and what it means for market prices looking ahead, download the IG Client Sentiment page.
Bitcoin Breakout May Have Further to Run
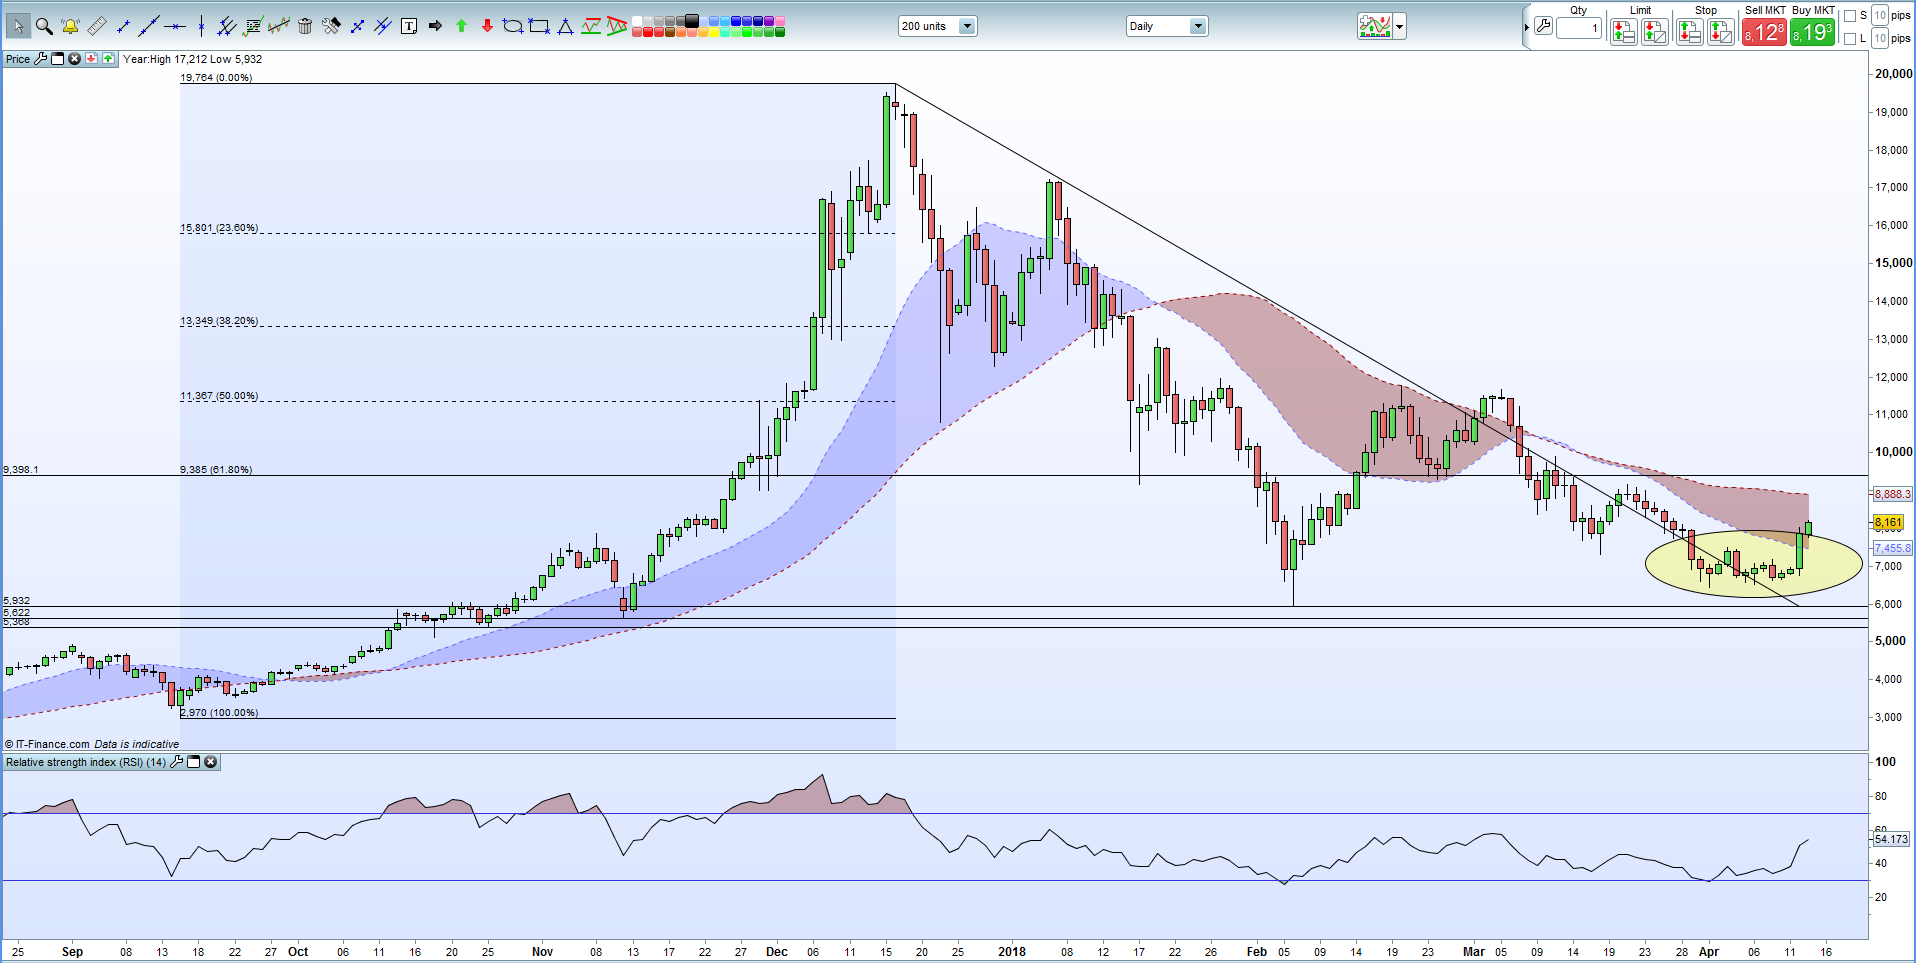
Bitcoin bulls will have enjoyed the later part of the week with BTC adding around 20% in the last two days. There were a lack of fundamentals drivers for the move but technical analysis pointed to a strong break above the December down trend, changing short-term market sentiment from negative to positive. To the upside the current 50-day moving average kicks-in just under $8,900 ahead of the 61.8% retracement at $9,385. The relative sentiment indicator also looks like it has further upside left. To the downside the February 6 low at $5,932 guards $5,622 and $5,388.
Bitcoin (BTC) Daily Price Chart in US Dollars(November 1, 2017 – April 13, 2018)
Ripple Buoyant But Resistance Looms
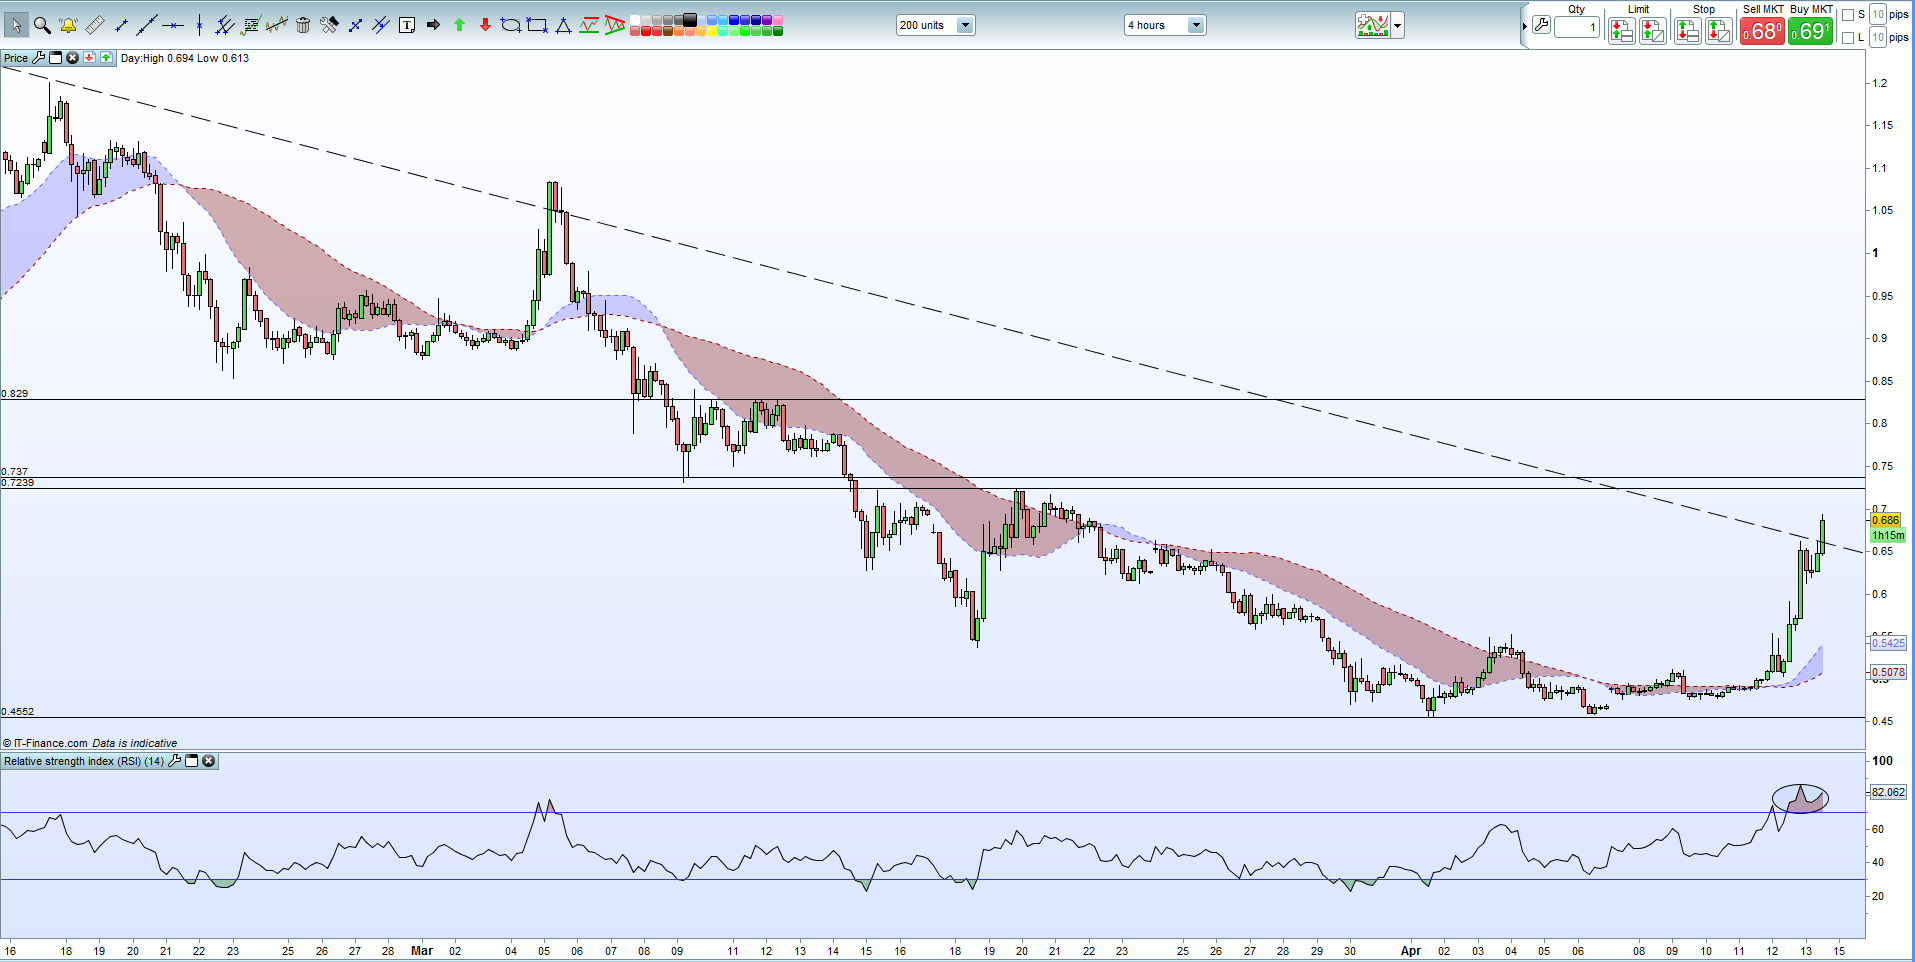
The third-largest crypto-coin by market capitalization has also enjoyed a strong run this week, climbing from around $0.45 to $0.68. Heavy Korean Won buying boosted the token while news that Japanese exchange SBI Holdings will help to liquidity in Japan also bought buyers back. The four-hour chart shows XRP nearing one-month resistance around $0.73 before $0.83 comes back into view. The RSI indicator is also in extreme overbought territory and may drag on any further upside. The IG Client Sentiment indicator also shows that retail remain overwhelmingly long XRP with net-longs currently standing at 96.6%.
Ripple (XRP) Four Hour Price Chart in US Dollars (February 15 – April 13, 2018)
Ethereum Rallies Nearly 50% in One Week
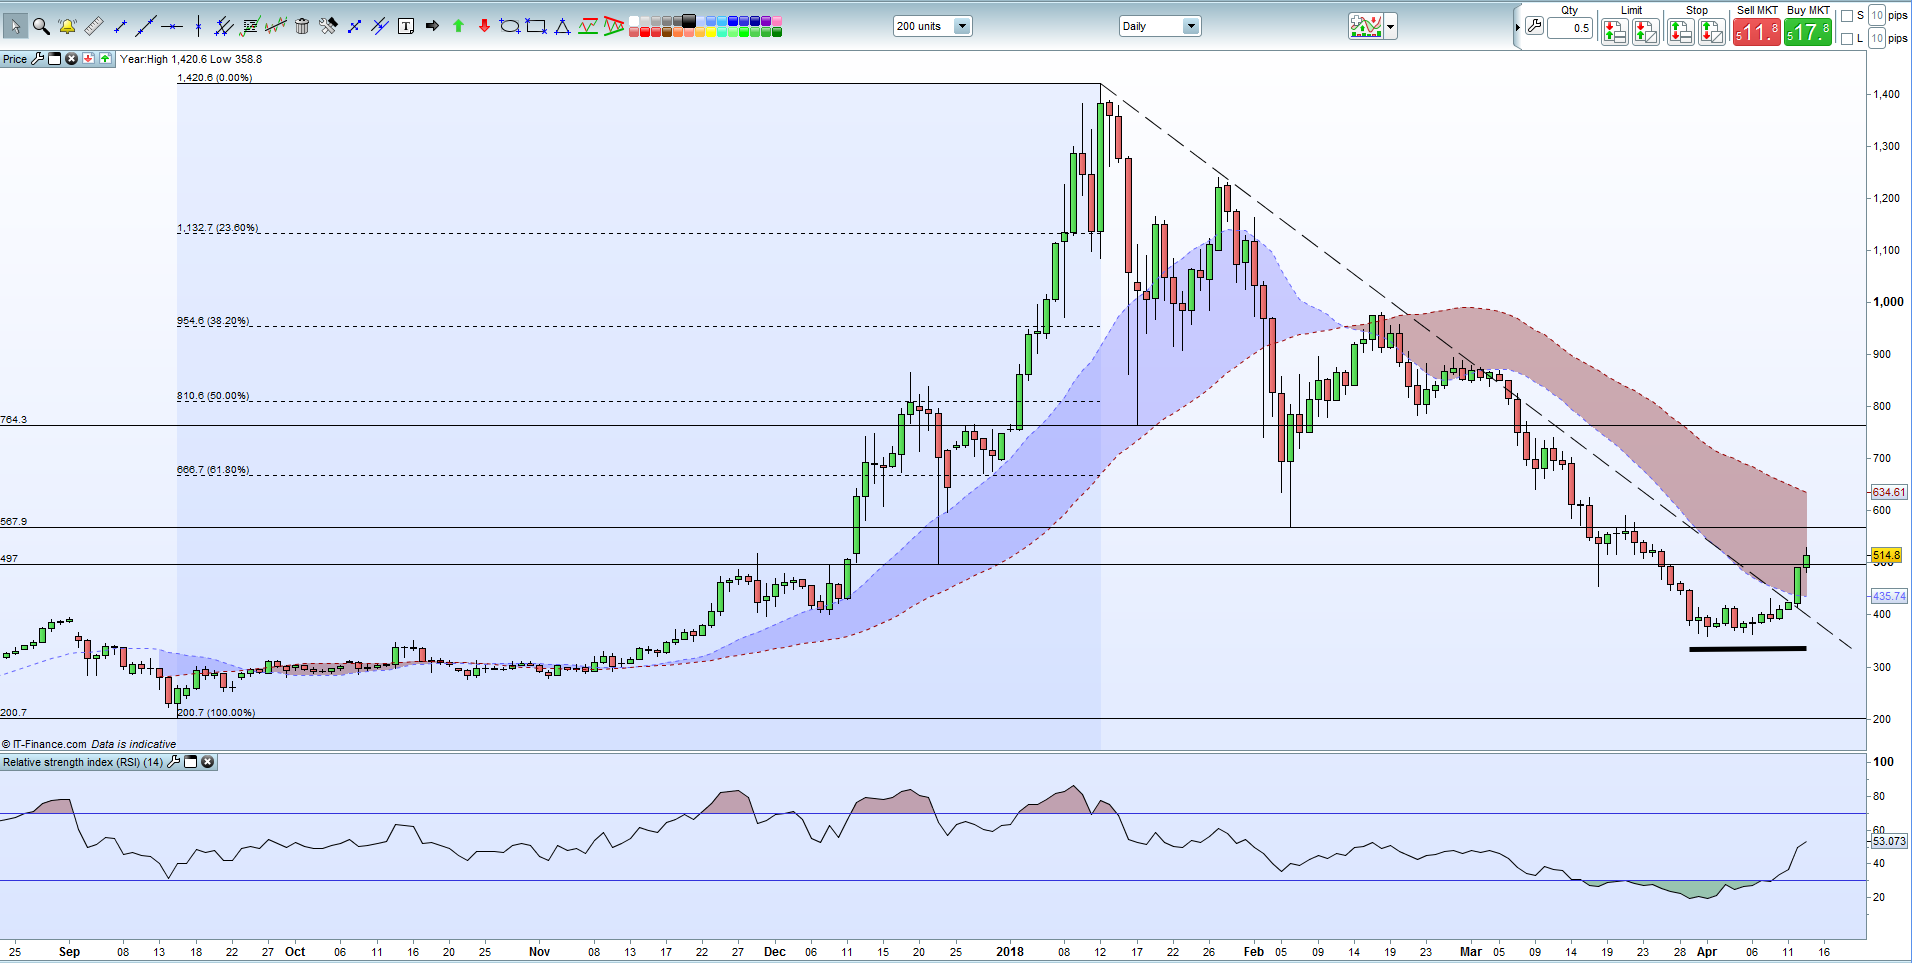
After respecting the down trend channel for the last three months, ETH has jumped sharply after building a base around $350 for a few days. The current price is now around 50% higher than this time last week, boosted by Thursday’s break of the down trend and the general positive sentiment in the market. Further upside targets start at $568, the current 50-day moving average at $635 and 61.8% retracement at $667. To the downside, $397 followed by $353 and $284.
.
Ethereum (ETH)Daily Price Chart in US Dollars (August 25, 2017 – April 13, 2018)
Litecoin Consolidation Then Break Higher
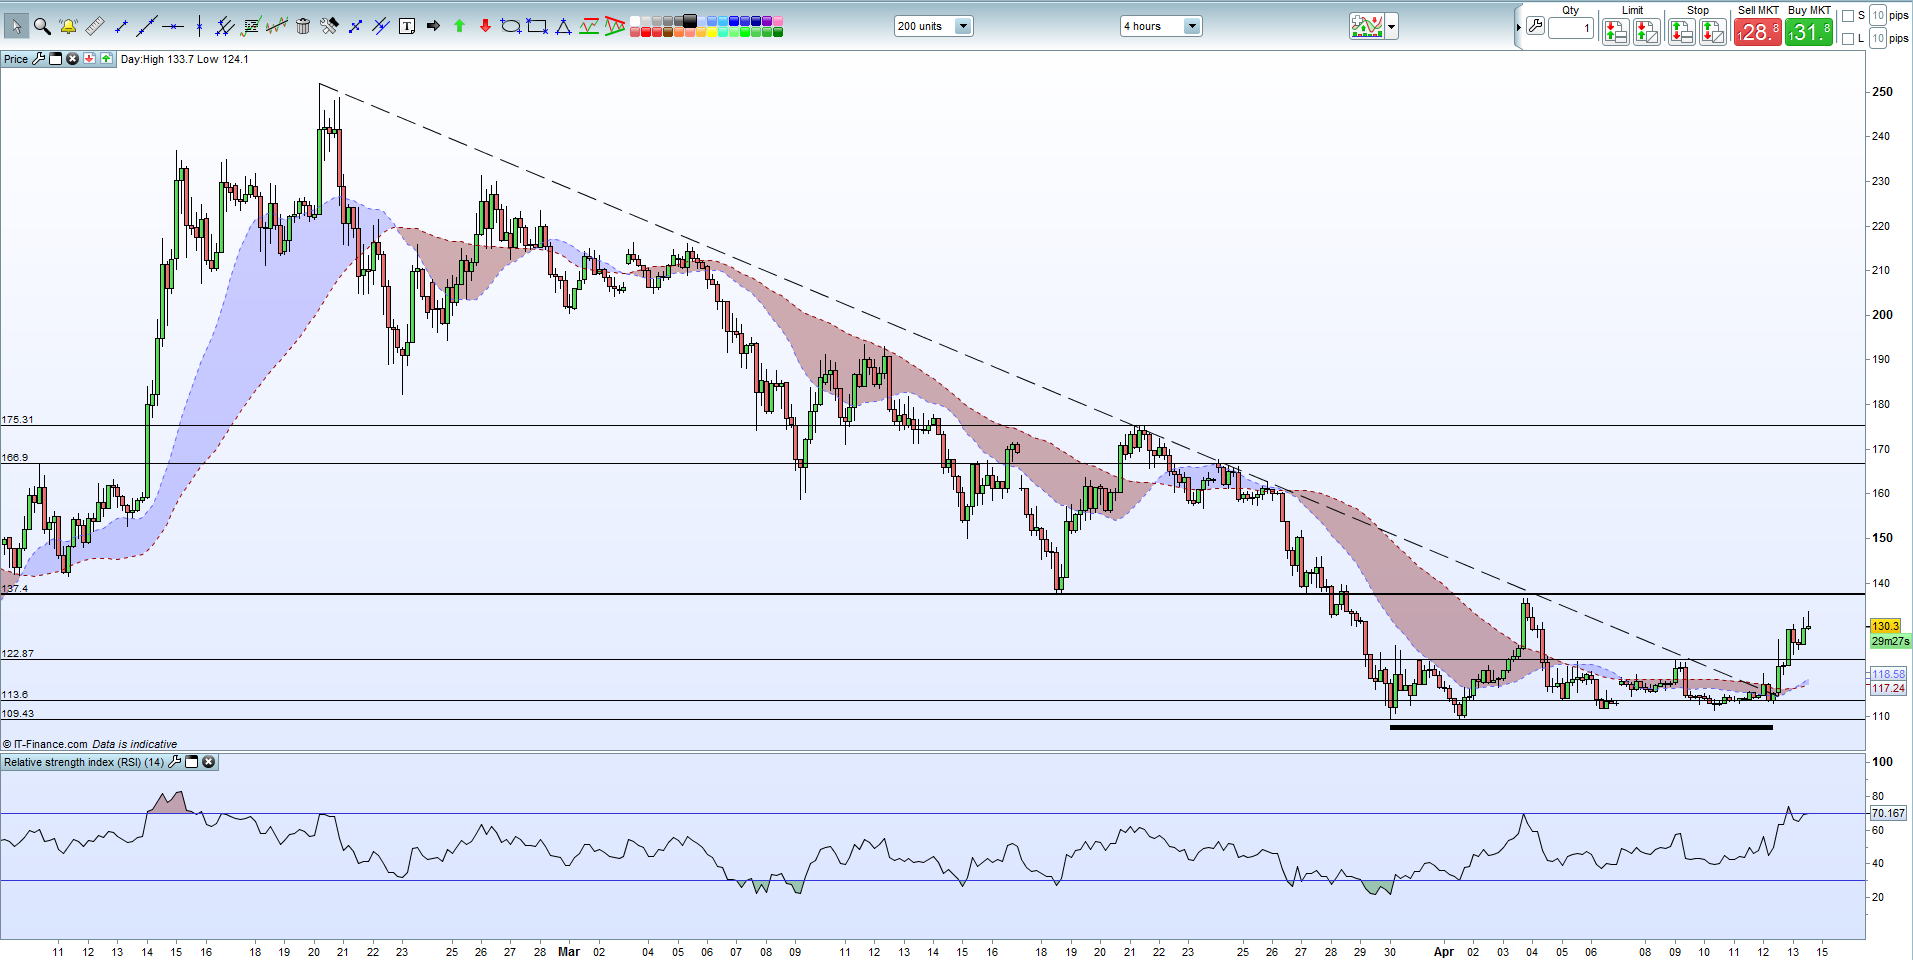
Litecoin is another to join the rally after having consolidated around $110 for the last two weeks. Again the break came at the junction with the down channel, with the 20-day ma now trading higher than 50-day ma, aiding the bull move. Reasonable resistance at $137 guards $167 and $175. To the downside, $123 ahead of $113 and $109. The RSI indicator currently is on the cusp of overbought territory.
Litecoin (LTC) Four Hour Price Chart in US Dollars (February 10 – April 13, 2018)
We run a Weekly Cryptocurrency Webinar every Wednesday at 12:00PM
What’s your view of the cryptocurrency market – oversold or overbought? You can leave your comments in the section below or you can contact the author by email at nicholas.cawley@ig.com or via Twitter @nickcawley1.
--- Written by Nick Cawley, Analyst.


