


Technical Highlights:
- EUR/USD needs to break range, USD/JPY outside of one
- In the commodity space; gold has big trend-line resistance, oil steady
- Global stock markets in for more trouble; S&P 500 outlook
With the new quarter set to begin, start off on the right foot by checking out the DailyFX Quarterly Forecasts & Trading Guides
EUR/USD needs to break range, USD/JPY outside of one
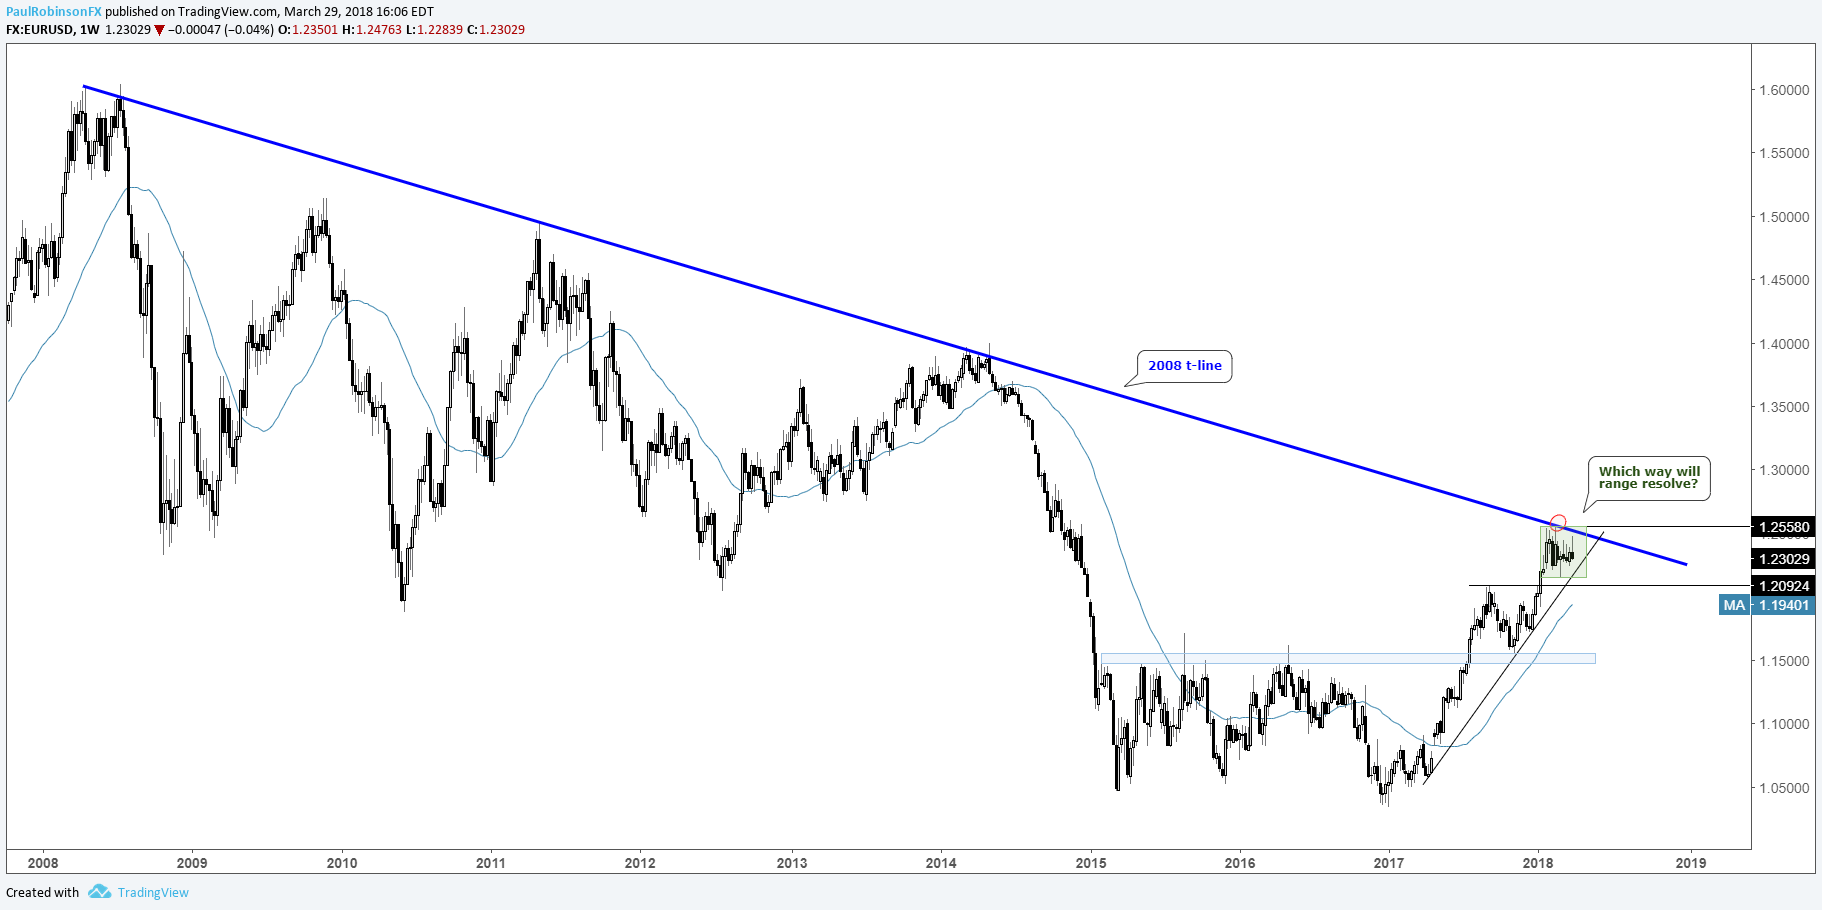
EUR/USD has spent the past couple of months treading water beneath the 2008 trend-line, with the question remaining as to whether it is consolidating for another leg higher or topping. A strong weekly close above the trend-line and the high at 12556 will have attention on levels carved out during 2013-14.
Conversely, a decline below the April trend-line and 2017 high at 12092 is seen as spurring downside momentum. Large speculators in the futures market remain steady in holding a historically large long position at 133k contracts, which isn’t in of itself a sign that the market is yet saturated with overly bullish market participants. However, should support start breaking there will be plenty of fuel to drive the euro lower.
EUR/USD Weekly Chart
For more in-depth analysis, check out the Q2 Forecast for EUR/USD
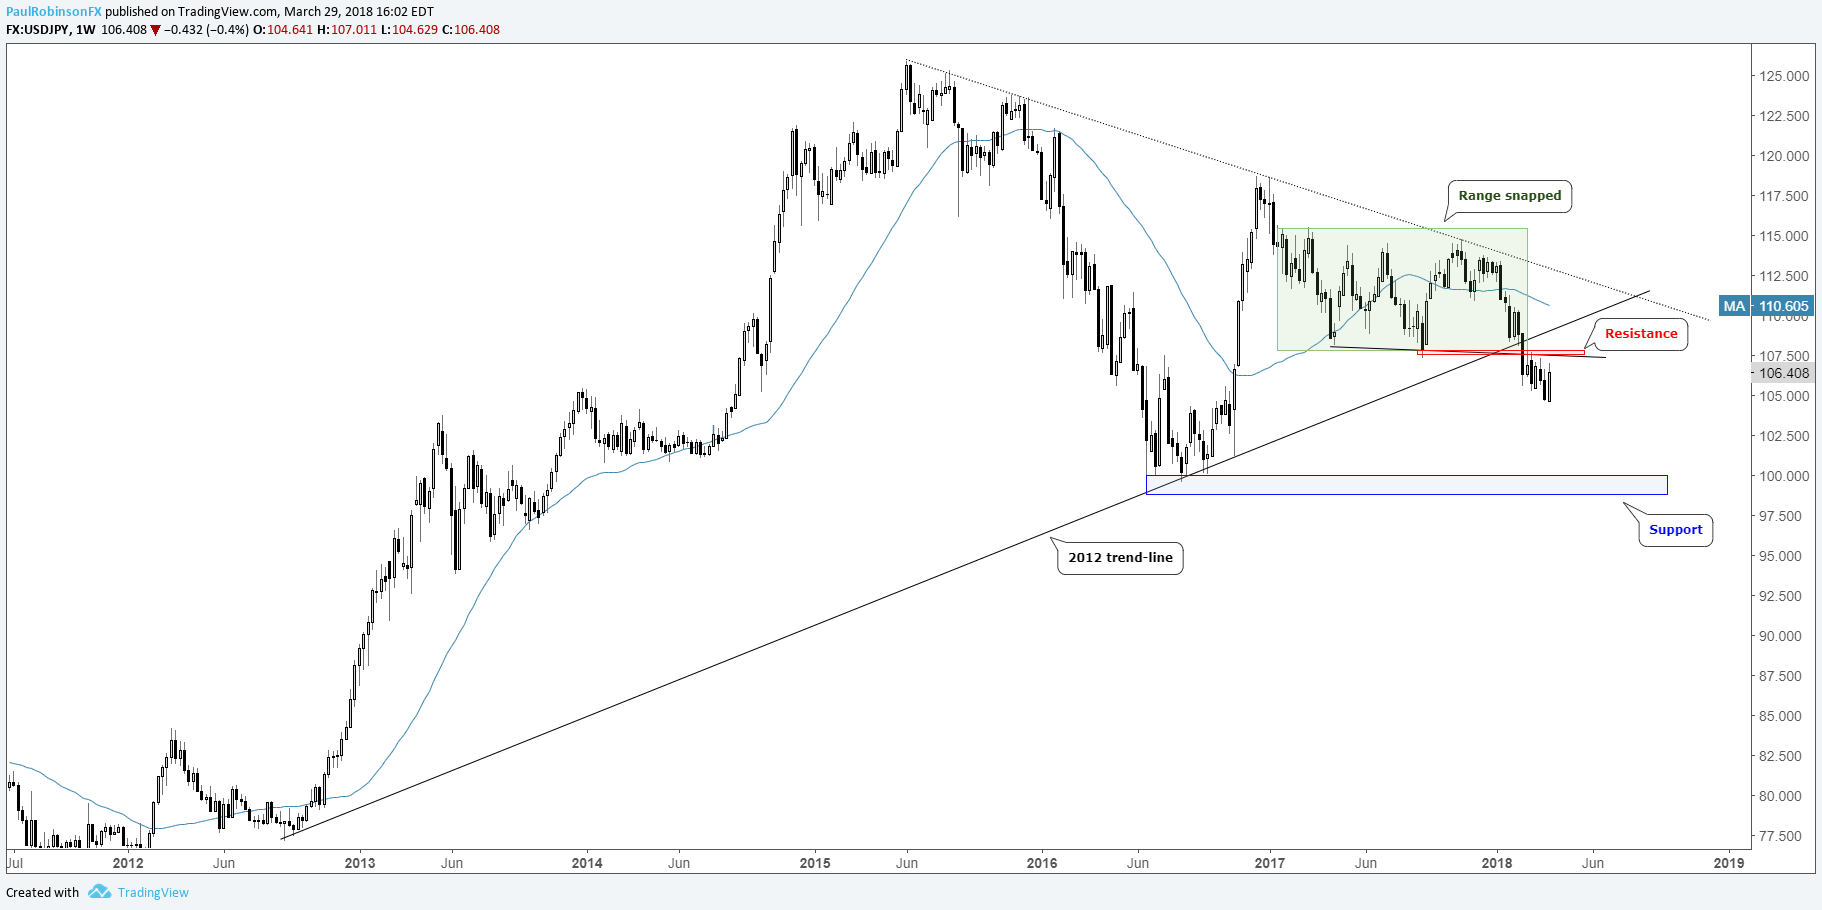
USD/JPY had a historically tight range during 2017, which was finally snapped only a few weeks into this year. Risk aversion is helping to propel the Japanese yen higher versus major currencies. USD/JPY is set to continue facing pressure in the month ahead with not only a breakdown in place, but the likelihood equity markets will be under stress.
Resistance clocks in around the vicinity of 10730/800. The next eyed level of support arrives in a zone created during the trough of 2016 in the vicinity of 10119/9879. If global stock markets come apart, those levels will be under serious threat of breaking.
USD/JPY Weekly Chart
For more in-depth analysis, check out the Q2 Forecast for USD/JPY
In the commodity space; gold has big trend-line resistance, oil steady
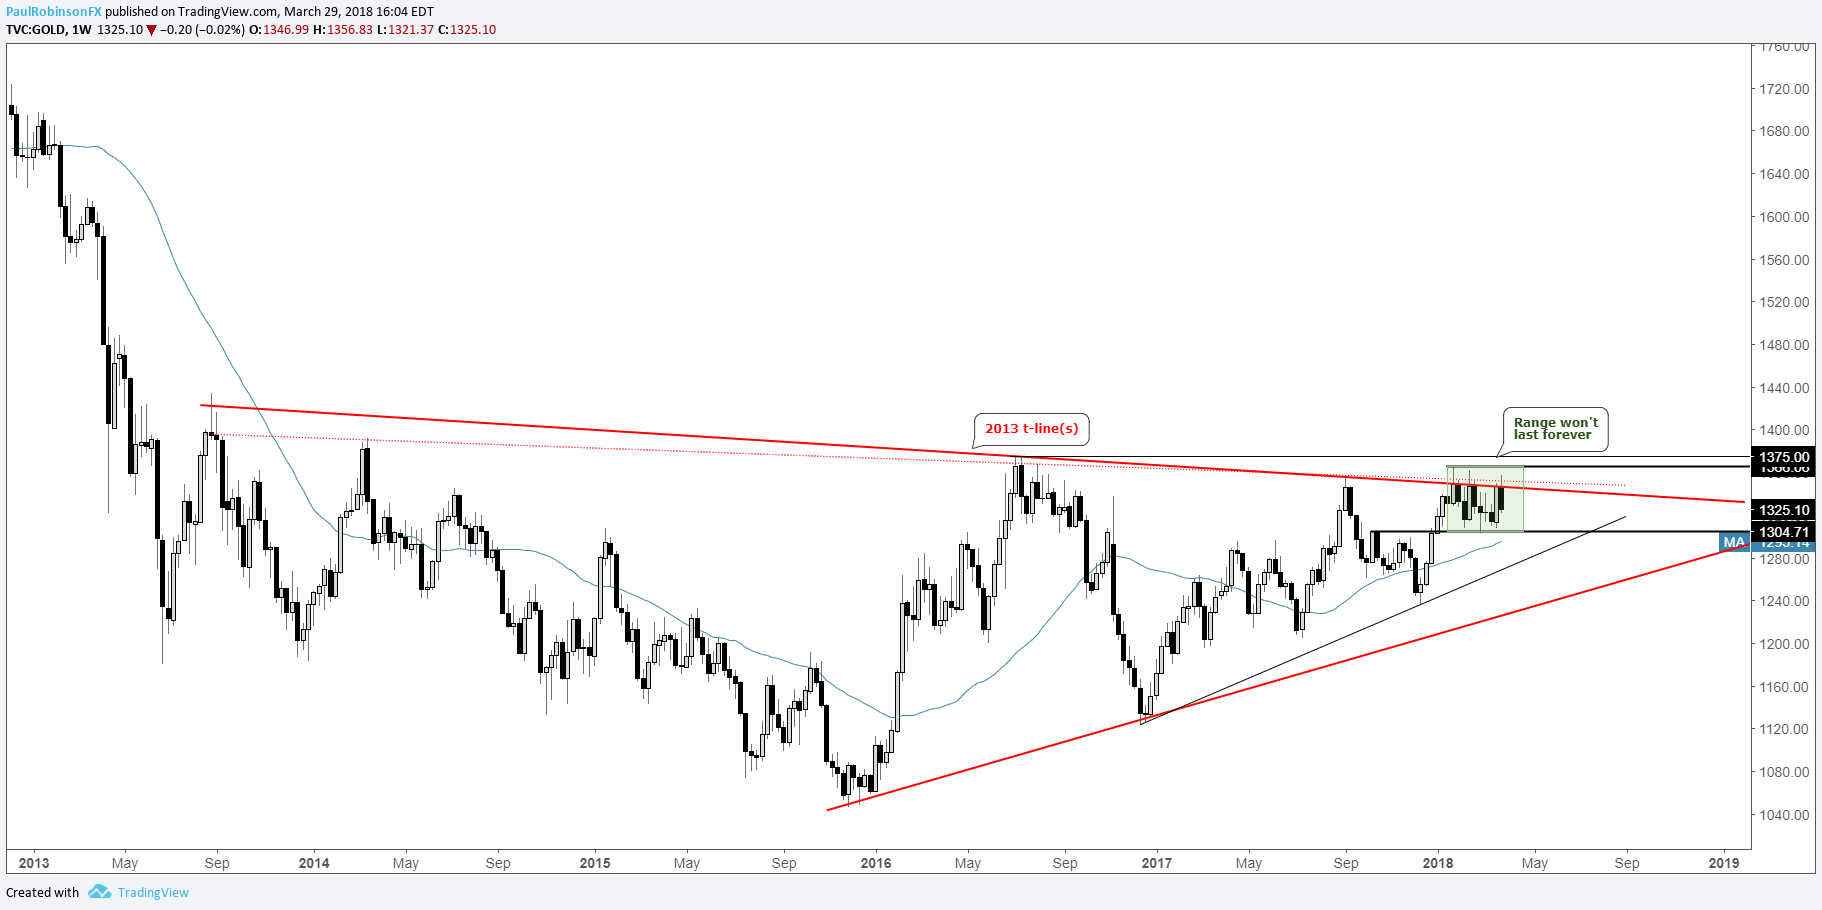
Gold has been a tough handle so far this year, with the 2013 trend-line proving problematic on each rise, most recently this week However, with each decline buyers are stepping in around 1300. Something has to give as the range between 1300 and 1366 won’t last forever.
A clean weekly close above the 2013 trend-line and rise beyond the first quarter high at 1366 will quickly bring the 2016 high at 1375 into focus. The pent-up price action to start the year suggests a sizable breakout could be in store, but confirmation is needed first.
A clean break below 1300 will have the 52-week MA and trend-line from December 2016 in play. If this develops, or worse, trade down to the trend-line from November 2015, then a macro-sized wedge could develop.
This scenario, will of course, take a while to fully mature. For now, watching bottom and top-side range levels. A USD resolution (euro directional move) will likely accompany any such breakout we see.
Gold Weekly Chart
For more in-depth analysis, check out the Q2 Forecast for Gold
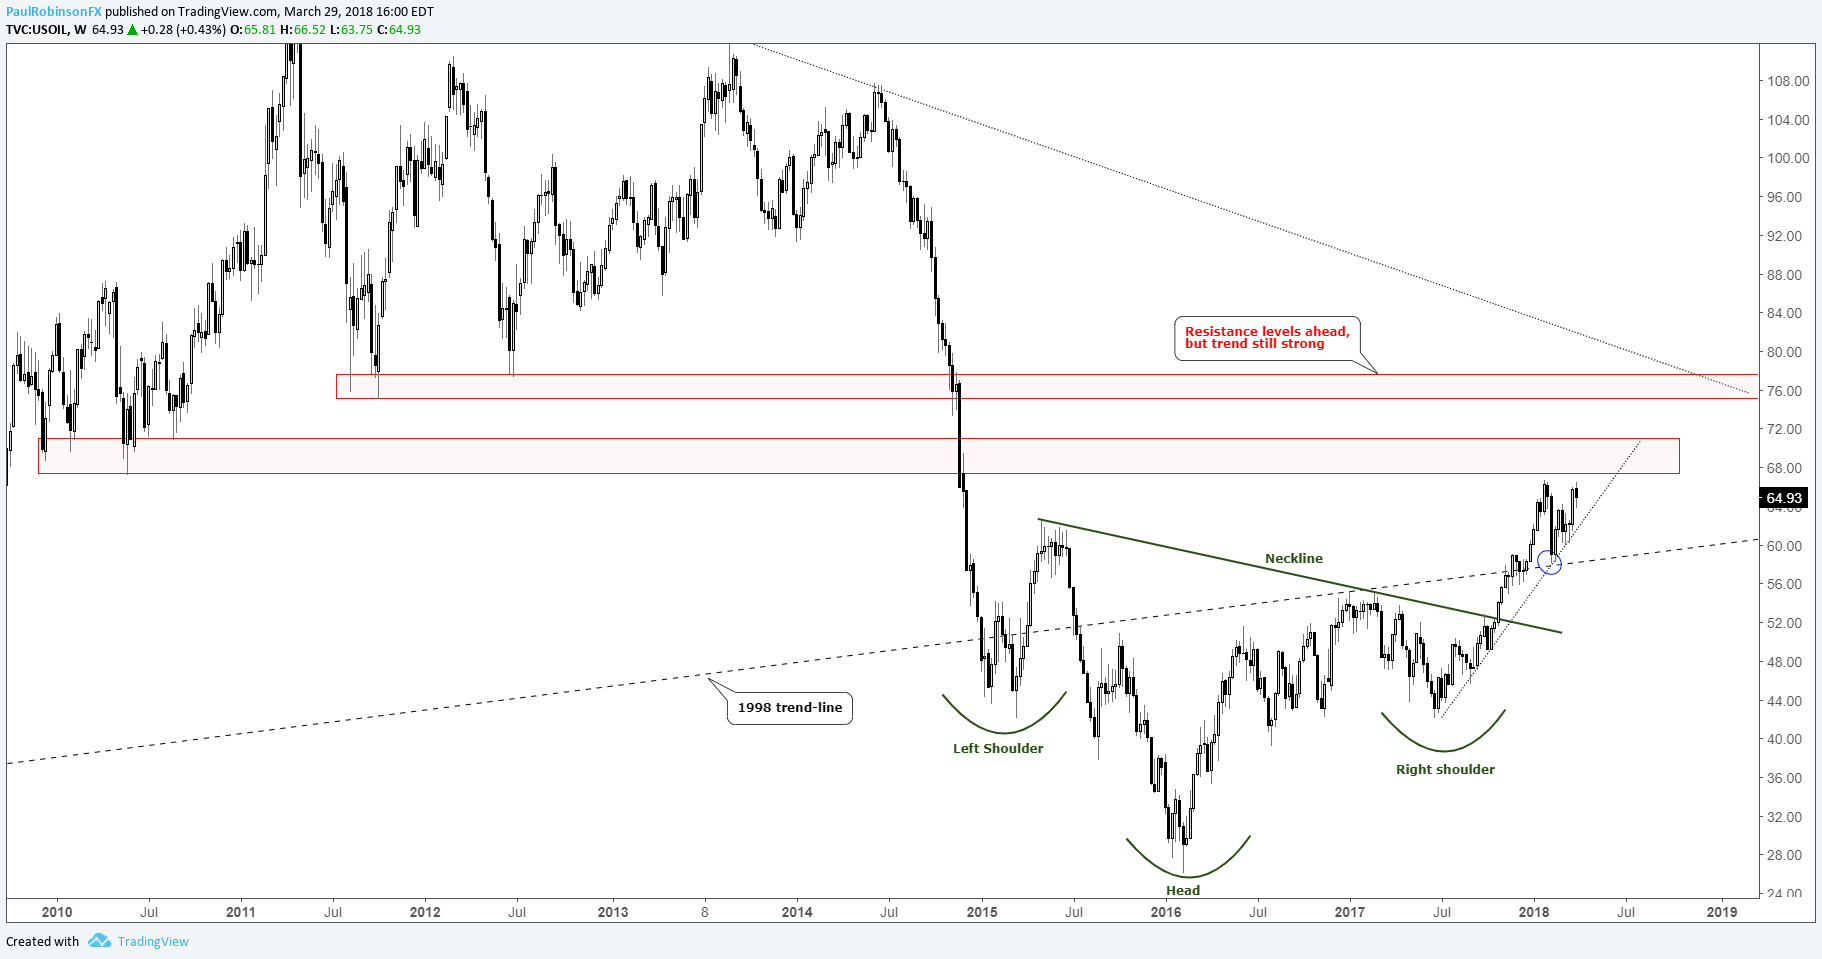
Crude oil continues to impresssince breaking out of a long-term inverse head-and-shoulders pattern back in October. Despite what presents as an overly bullish oil market as per positioning in the futures market (+704k contracts long), oil continues to find fresh buyers.
The slope extending higher since the 1998 low held as support in February and will be a key line of support for the longer-term outlook. There is resistance not far ahead from 67.50 to around 71, then beyond there 77-80. The depth of the H&S pattern points to a move to 85 based on using a measured move target. This would have a test or better of the trend-line off the 2008 high in play.
Despite positioning concerns and resistance ahead, the outlook for oil remains tentatively bullish for as long as it continues to carve out higher lows on the weekly chart. Market positioning, just as is the case with the euro, won’t be a concern until damage is done to the chart.
Crude Oil Weekly Chart
For more in-depth analysis, check out the Q2 Forecast for Crude Oil
Global stock markets in for trouble, S&P 500 to suffer more
To end last year, we pointed to signs which suggested we could be on the cusp of a top in the S&P 500, and if not ‘the’ top at least a shift to a new regime of higher volatility. (S&P 500 Outlook – Signs Point to a Rougher Ride in 2018)
So far, 2018 has not disappointed in terms of providing more volatility for traders. This is likely to persist for the foreseeable future, with an elevated floor in the CBOE Volatility Index (VIX) in the low teens.
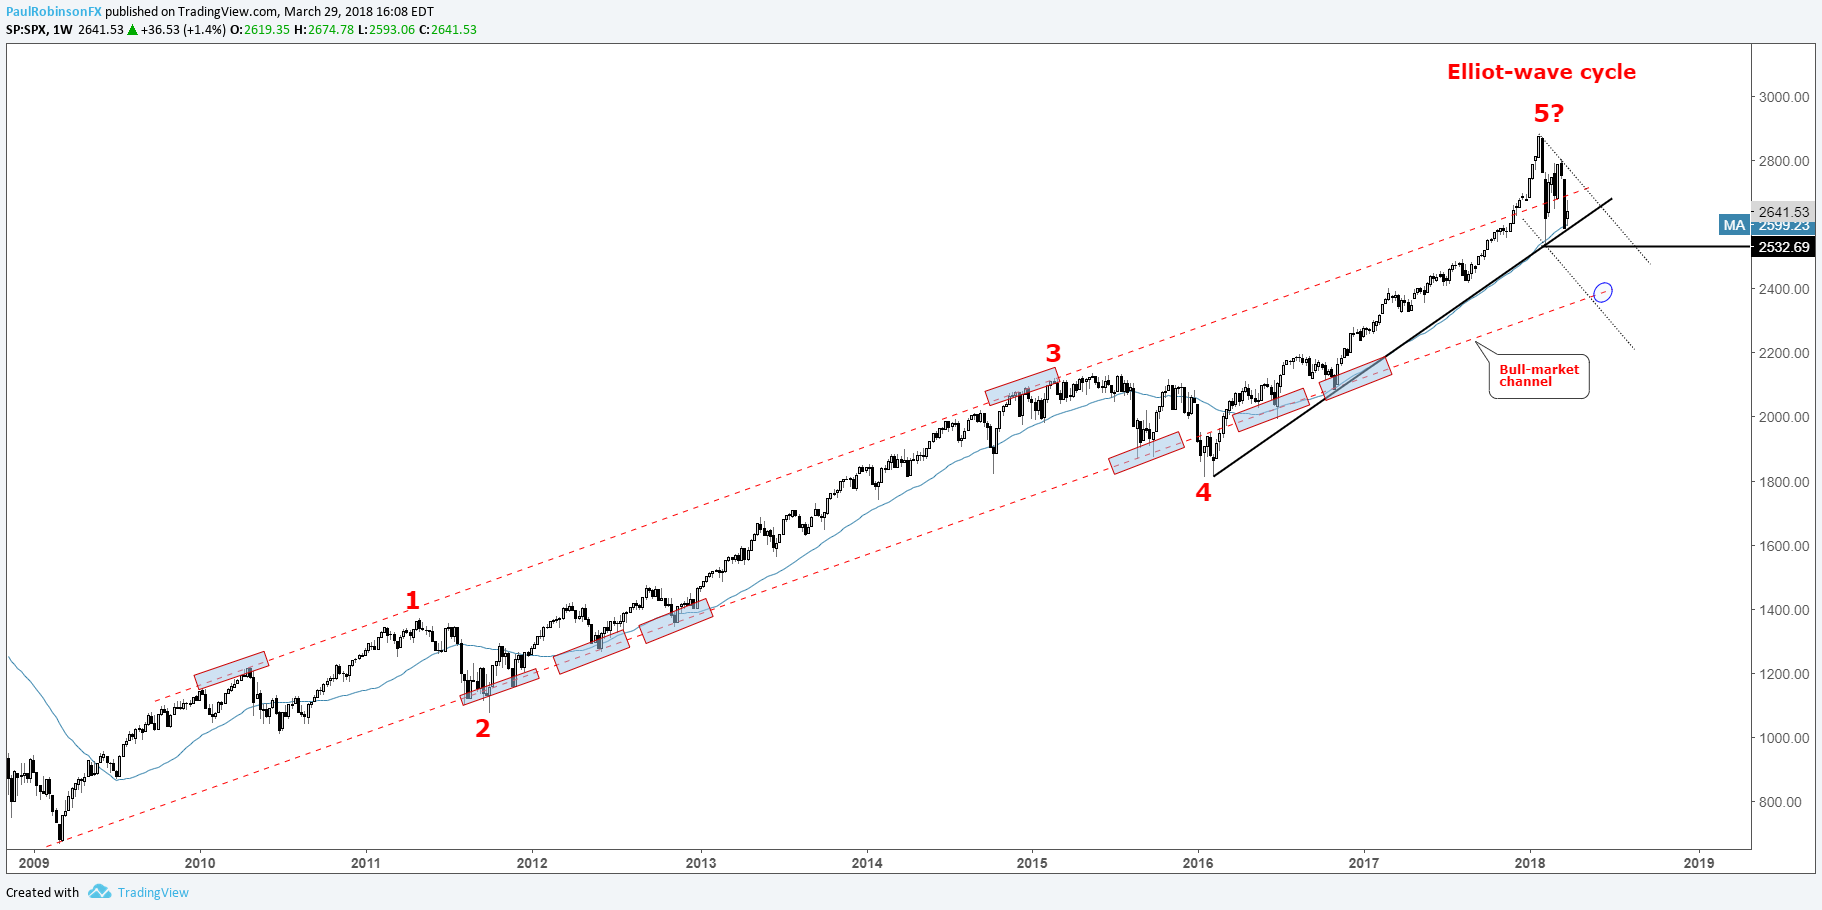
The 200-day MA and February 2016 trend-line are in confluence and viewed as a significant line-the-sand. We saw it hold last month and is attempting to hold once again. A break below could have stocks reeling towards the lower slope of the bull-market channel dating back to the 2009 low.
This is a good distance lower, but certainly conceivable given how overbought, over bullish the market became heading into this year. The high in January may have marked the end of wave 5 in an Elliot-wave cycle over the past 9 years. This would corroborate a bearish bias on a break of the more intermediate-term trend-line from 2016.
S&P 500 Weekly Chart
For more, see the Q2 Forecast for Global Equity Indices
Helpful Resources
Whether you are a new or experienced trader, we have several resources available to help you; indicator for tracking trader sentiment, quarterly trading forecasts, analytical and educational webinars held daily, trading guides to help you improve trading performance, and one specifically for those who are new to forex.
---Written by Paul Robinson, Market Analyst
To receive Paul’s analysis directly via email, please SIGN UP HERE
You can follow Paul on Twitter at @PaulRobinsonFX


