


The other day we highlighted the weekend reversal bars carved out across the cryptocurrency spectrum, making note of how it should lead to further upside in the short-term. However, we are already seeing those bounces fizzle and the likes of Ethereum, Ripple, and Litecoin look headed towards taking out their respective key-reversal daily lows. If this happens look for another wave of selling to further damage the charts.
Traders are generally long Bitcoin, suggesting more weakness; See how positioning changes can help determine price direction on the IG Client Sentiment page.
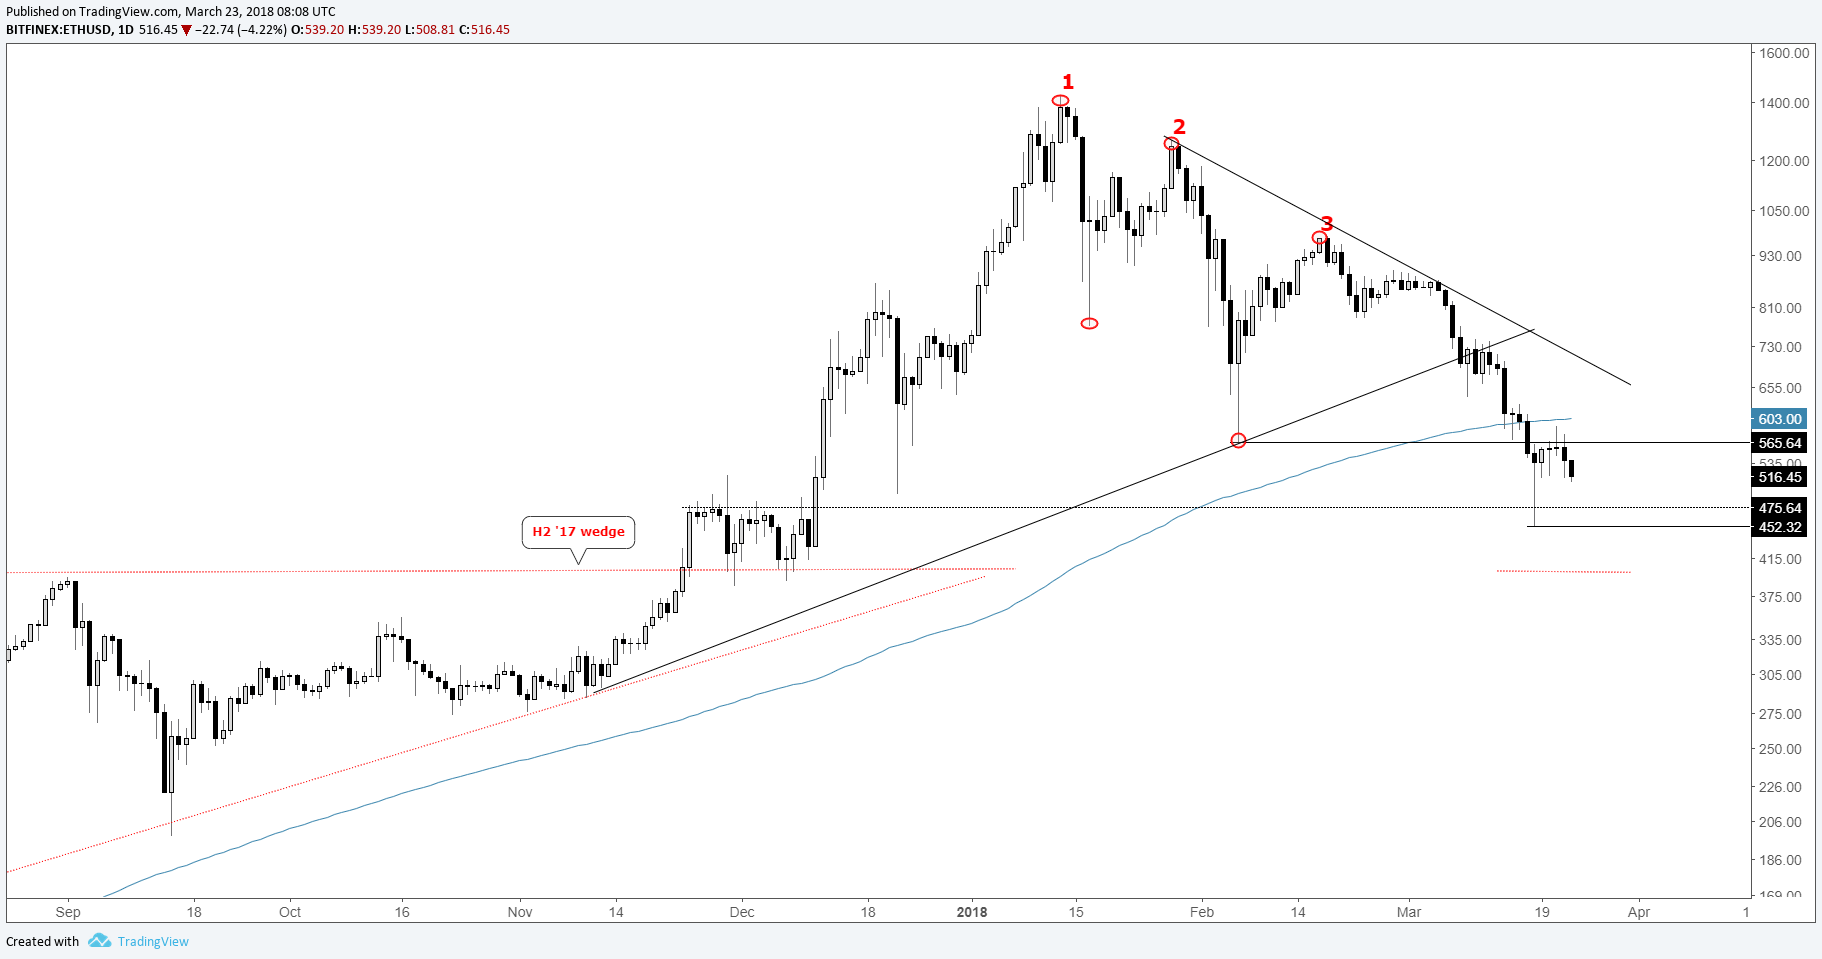
Ethereum failing to climb above February spike-low
Ethereum (ETH/USD) had a swift reversal from around a congestion formed during November/December, but that powerful turnabout is already at risk of failing. The important February spike-low and 200-day MA are proving to be too much despite the abrupt pause in the recent decline.
A break of 452 will negate the bullish implications of the 3/18 reversal and have momentum back in favor of shorts. Looking lower, there is support around 400 from the wedge that formed during the second-half of 2017. This may be another point which gives pause to further weakness.
Check out this guide to learn more about how to trade Bitcoin and other cryptocurrencies.
ETH/USD Daily Chart
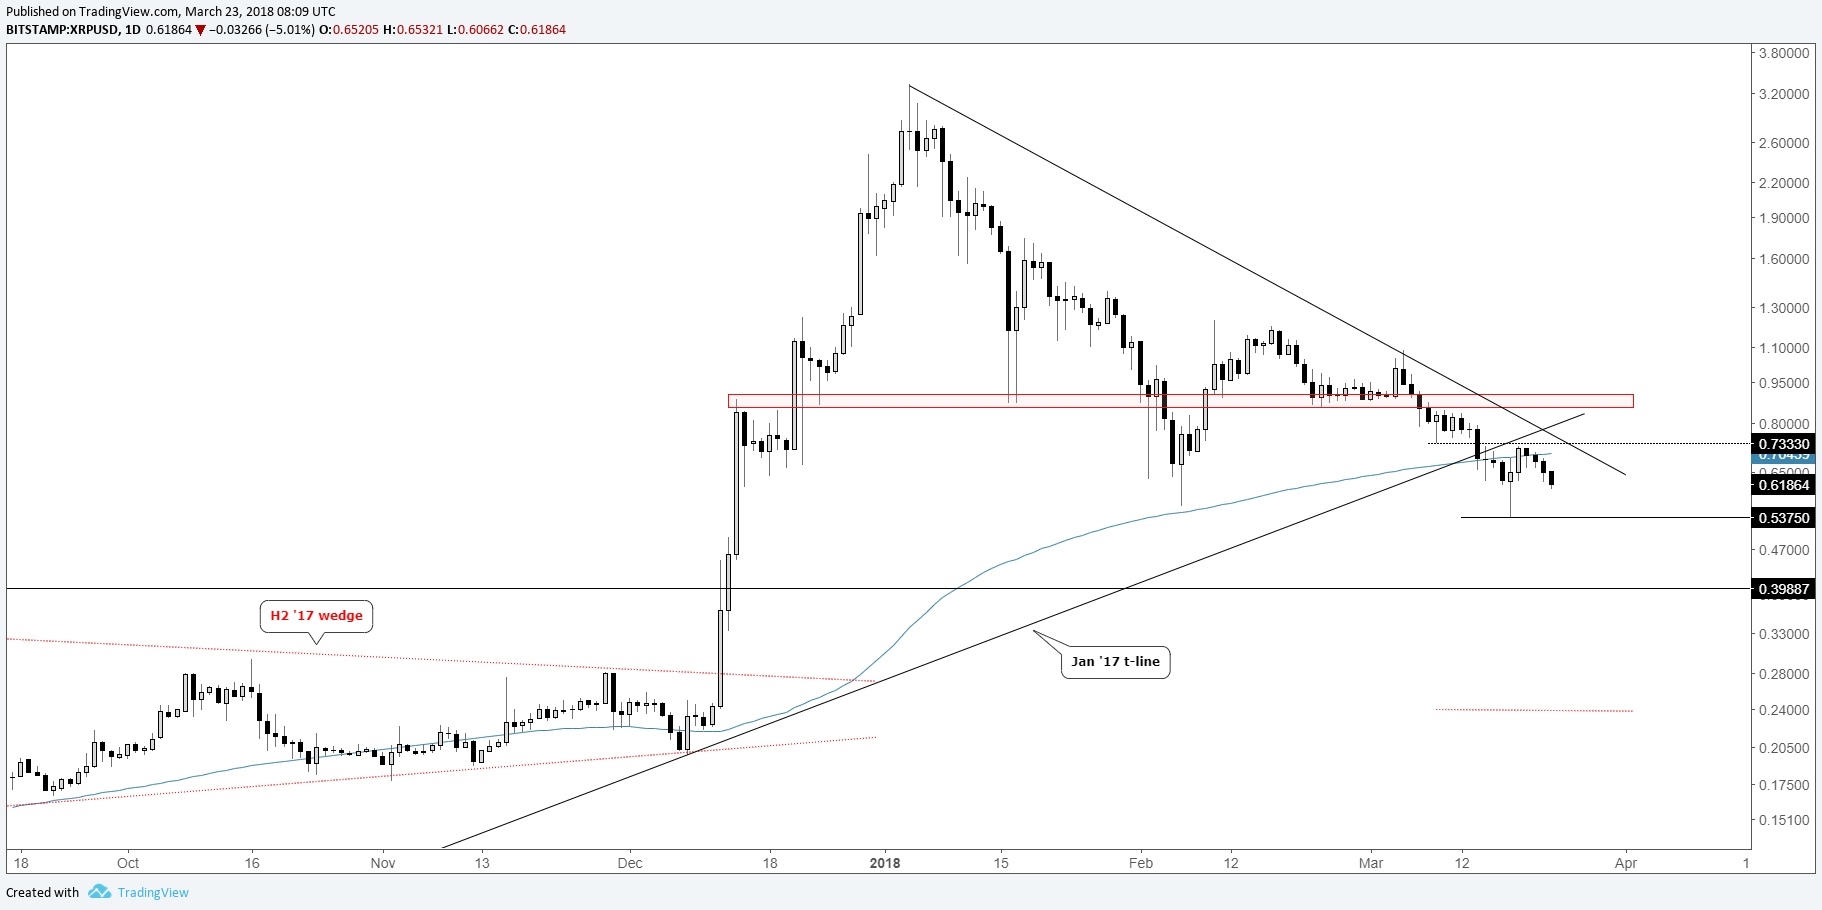
Ripple chart undermined by January 2017 trend-line break
Ripple (XRP/USD) dropped below the January 2017 trend-line before putting in a reversal day of its own, which already took a little wind out of the key-reversal. The 3/18 turn led to exactly one follow-through day as a result (just above the 200-day MA) and is now at risk of breaking the recent low at 5375.
A drop below will again have lower prices on the radar, with the next level of support arriving at just a shade under 40 cents. As is the case with Ethereum, still looking for a full reversal of the rally out of the H2 2017 wedge, which would take it all the way down to 25 cents.
XRP/USD Daily Chart
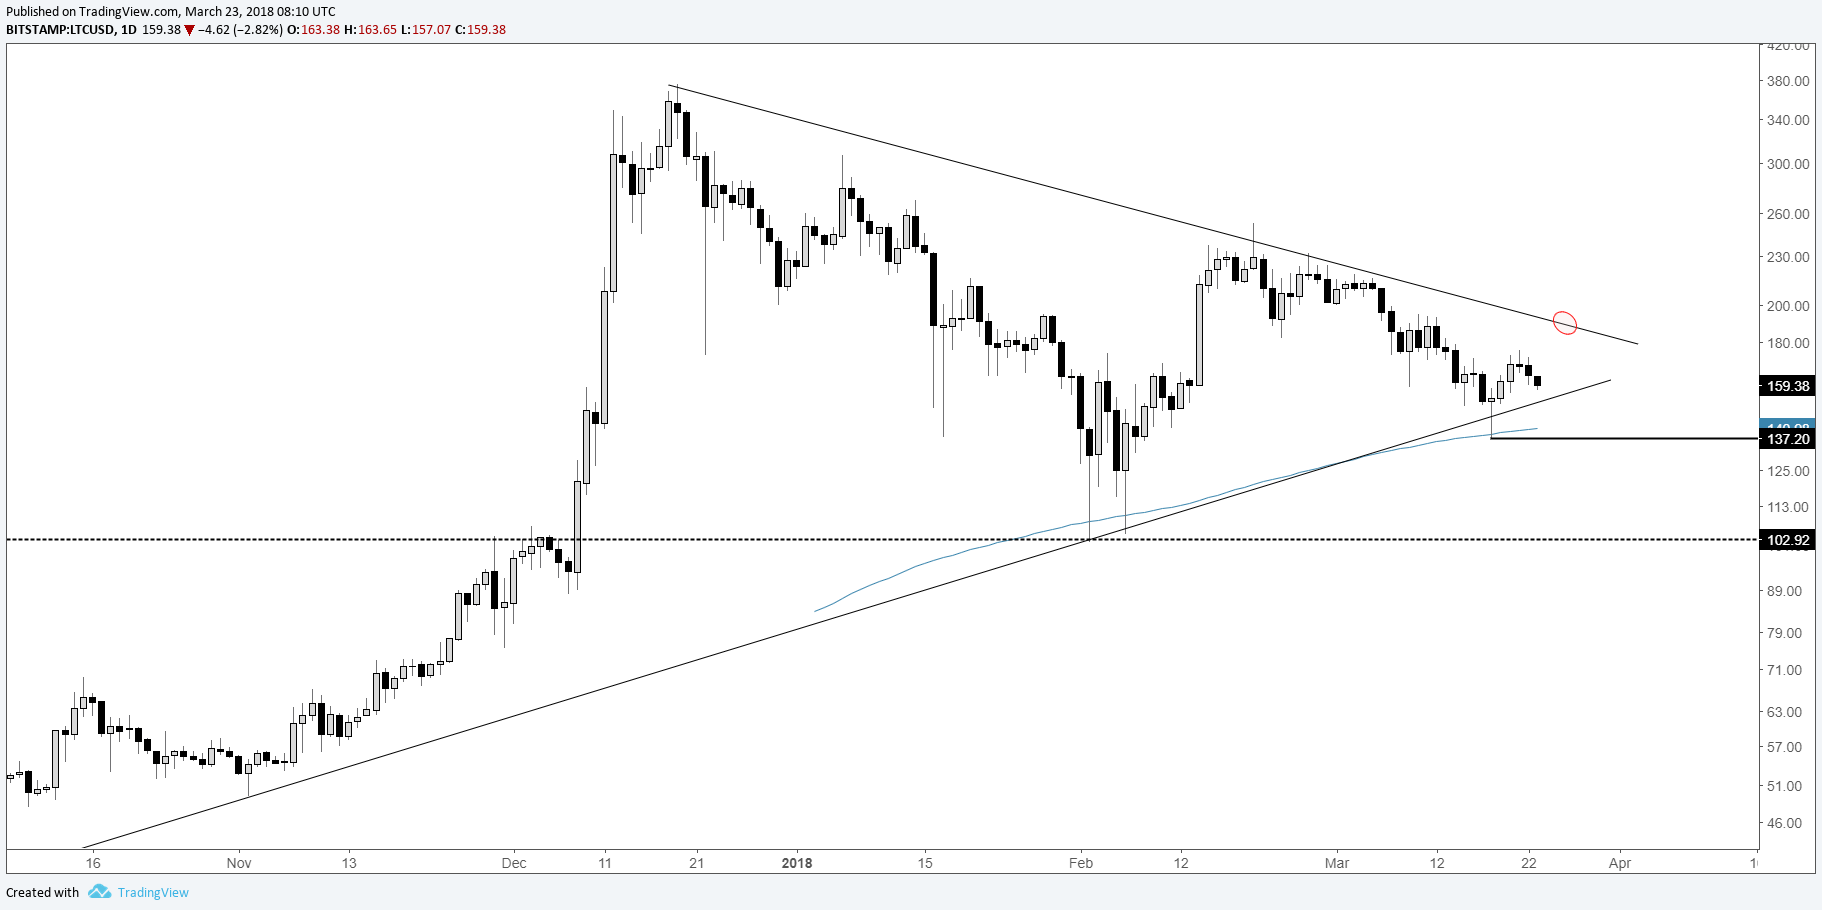
Litecoin reversal off September trend-line, 200-day may soon fail
Litecoin (LTC/USD) reversed around solid support by way of the September trend-line in confluence with the 200-day MA. This has this particular crypto positioned a bit better, but as goes the group will go Litecoin. A break of 137 will have not only be a breach of the bullish reversal, but also the aforementioned confluence of support.
This will have eyes down towards 103 as the next level of support, a substantial drop but very doable in fairly short order. Should it maintain a bullish posturing, the trend-line off the December high should prove problematic.
LTC/USD Daily Chart
Resources for Cryptocurrency Traders
Whether you’re a new or experienced cryptocurrency trader, we have several resources to help you;Introduction to bitcoin trading guide, indicator for tracking trader sentiment, and a weekly webinar discussing the latest developments.
---Written by Paul Robinson, Market Analyst
To receive Paul’s analysis directly via email, please SIGN UP HERE
You can follow Paul on Twitter at @PaulRobinsonFX


