


Cryptocurrencies are starting to plunge again, and the bottom may be nowhere in sight. We’ve been taking note of topping patterns, most recently on the Ethereum chart, which ominously point to much lower prices. The group could shave another 30-50% off current prices before finding tradeable lows. But targets for some, such as Ripple, are even further down. Despite the speculative fervor moving sharply in reverse there will remain plenty of tradeable volatility to take advantage of along the way.
Traders are generally long Bitcoin, suggesting more weakness; See how positioning can help determine price direction on the IG Client Sentiment page.
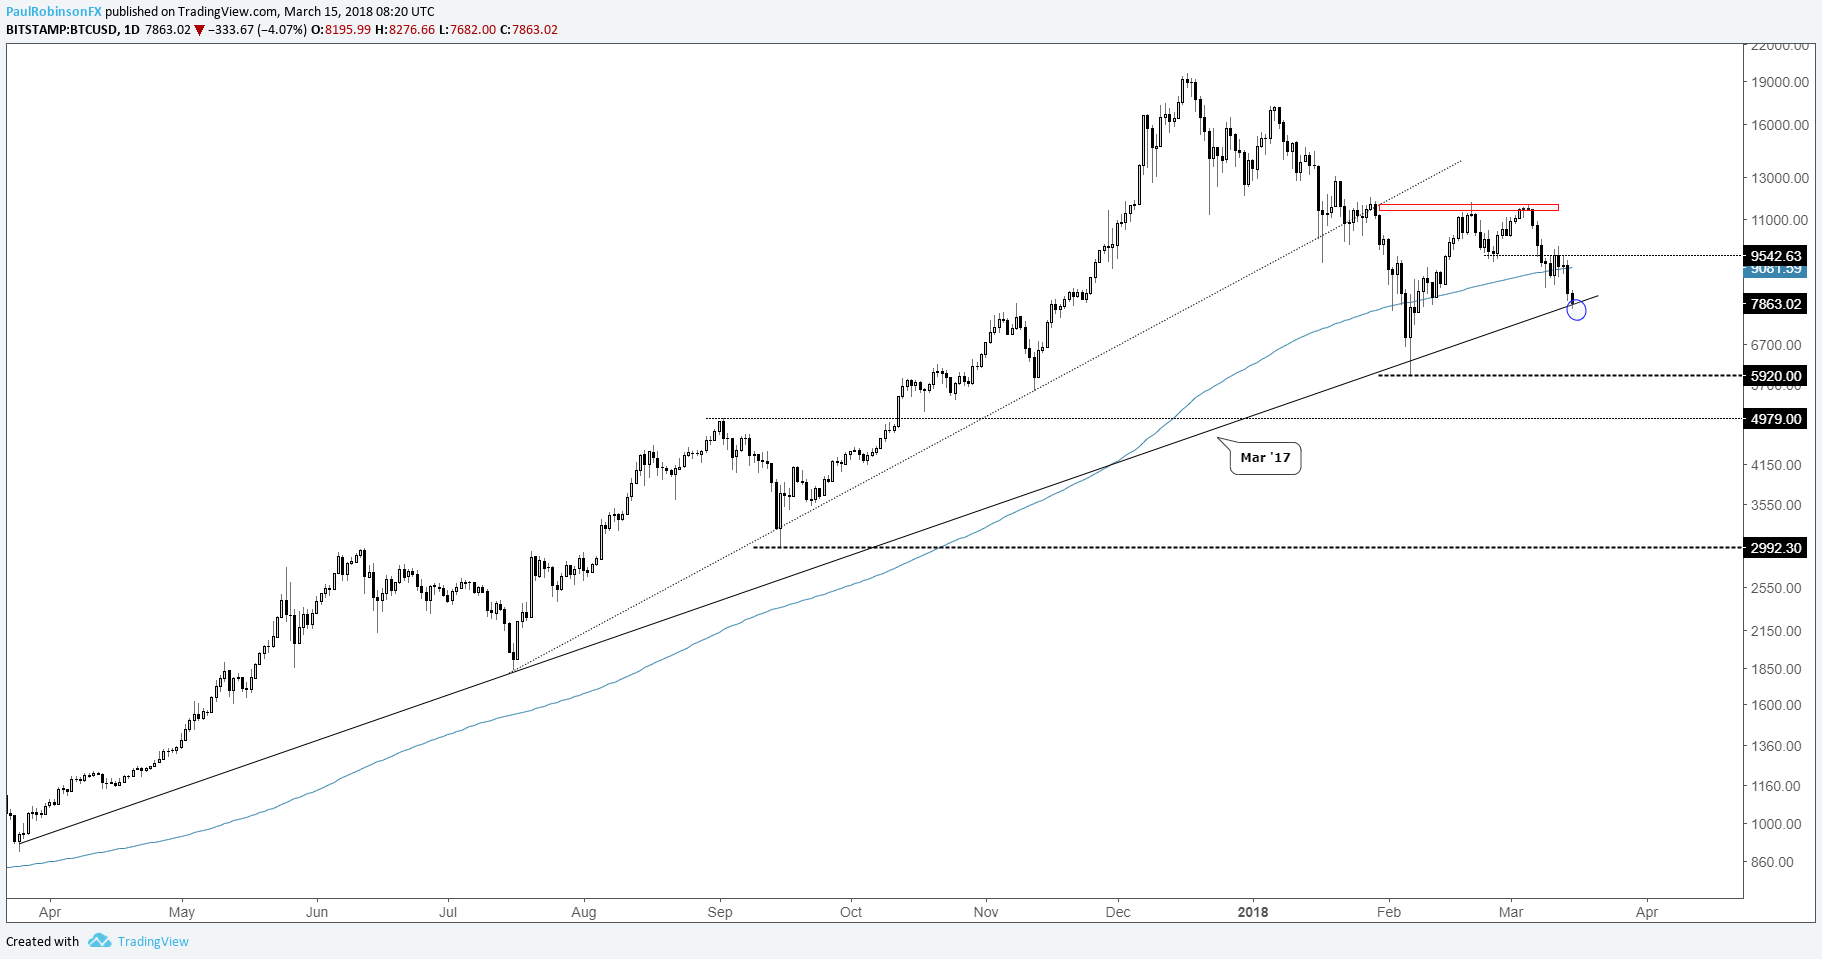
Bitcoin setting up for a drop to 5k and worse
Bitcoin continues to roll over from resistance in a fairly aggressive fashion and could soon accelerate as it closes in on the Feb spike-low at 5920. It’s currently trading on a one-year trend-line, which may give it short-term support, but the way the sector is behaving it doesn’t appear it will hold.
First up below is the Feb spike-low, and on a lower-low looking to a peak from September just under 5k. From a tactical standpoint, the trend-line at the immediate moment makes for a tricky spot for sellers until broken. Would-be longs could use the line as a threshold from which to enter and use to assess risk.
Check out this guide to learn more about how to trade Bitcoin and other cryptocurrencies.
BTC/USD Daily Chart
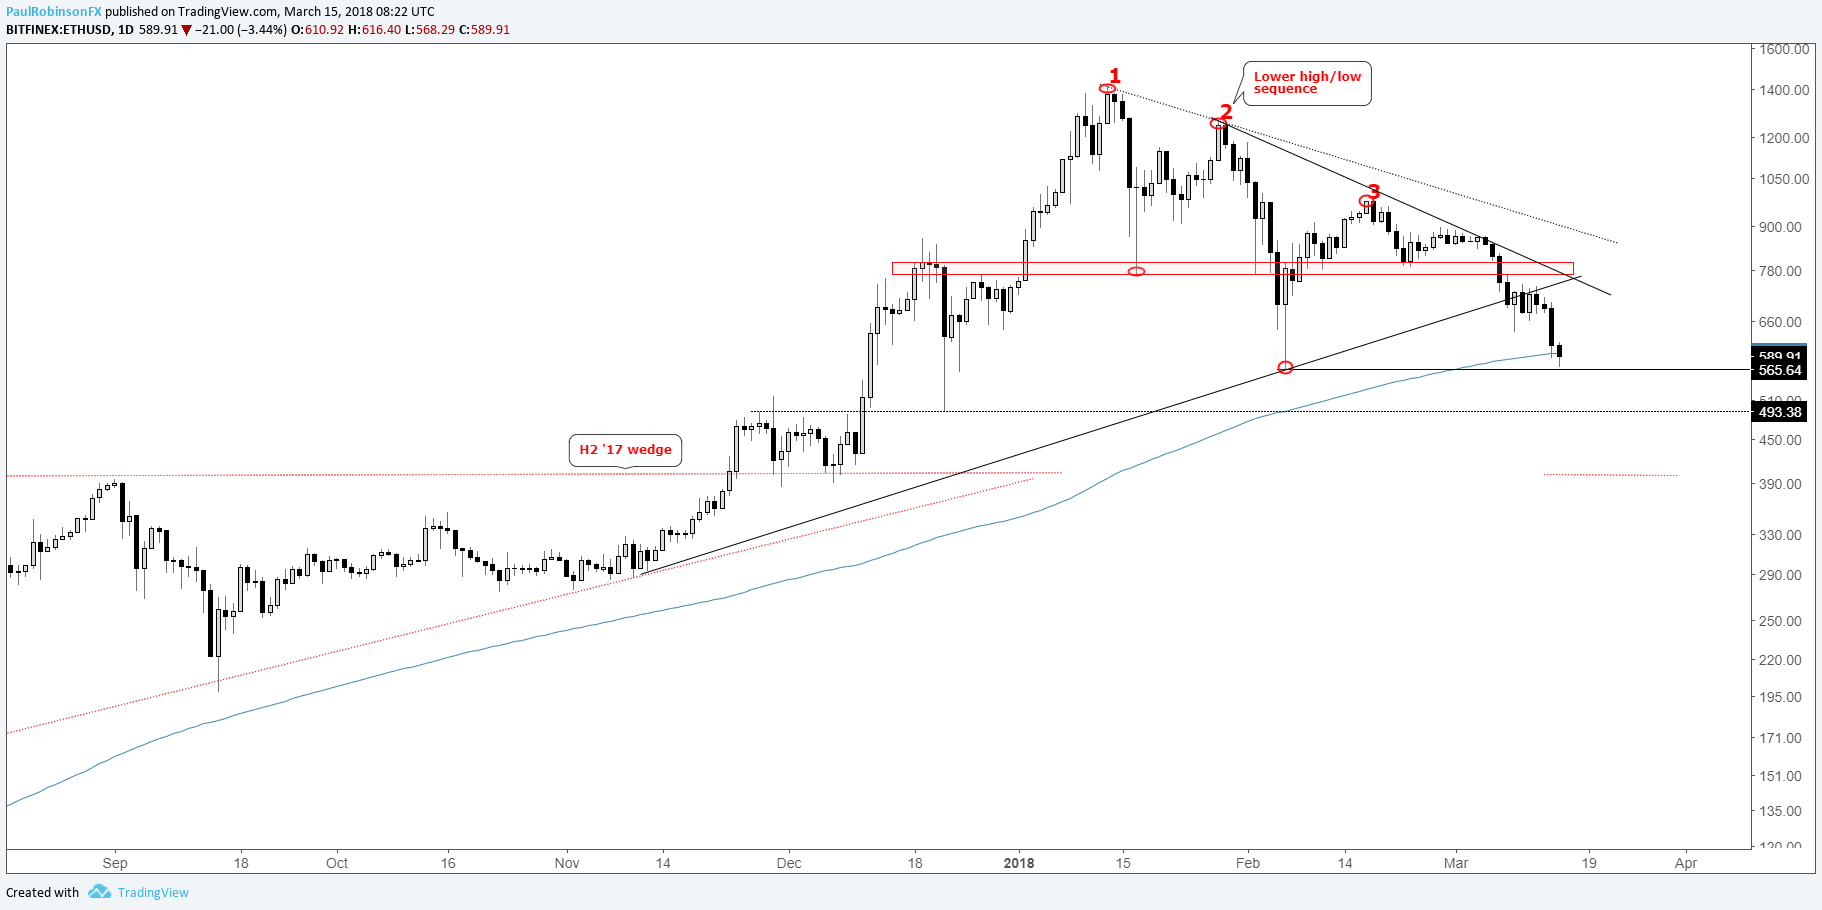
Ethereum rolling over from topping formation, 400 targeted
Ethereum is already in jeopardy of breaking the Feb spike-low, an expectation we outlined not long ago as the cryptocurrency’s chart was in the process of carving out a bearish price sequence involving three peaks.
Below the 2/6 low lies a level from late last year around 493, then looking to the apex of the ascending wedge from the second-half 2017, arriving around 400. Much lower prices could be in store beyond 400, but for now that is where we’ll start as an initial target.
ETH/USD Daily Chart
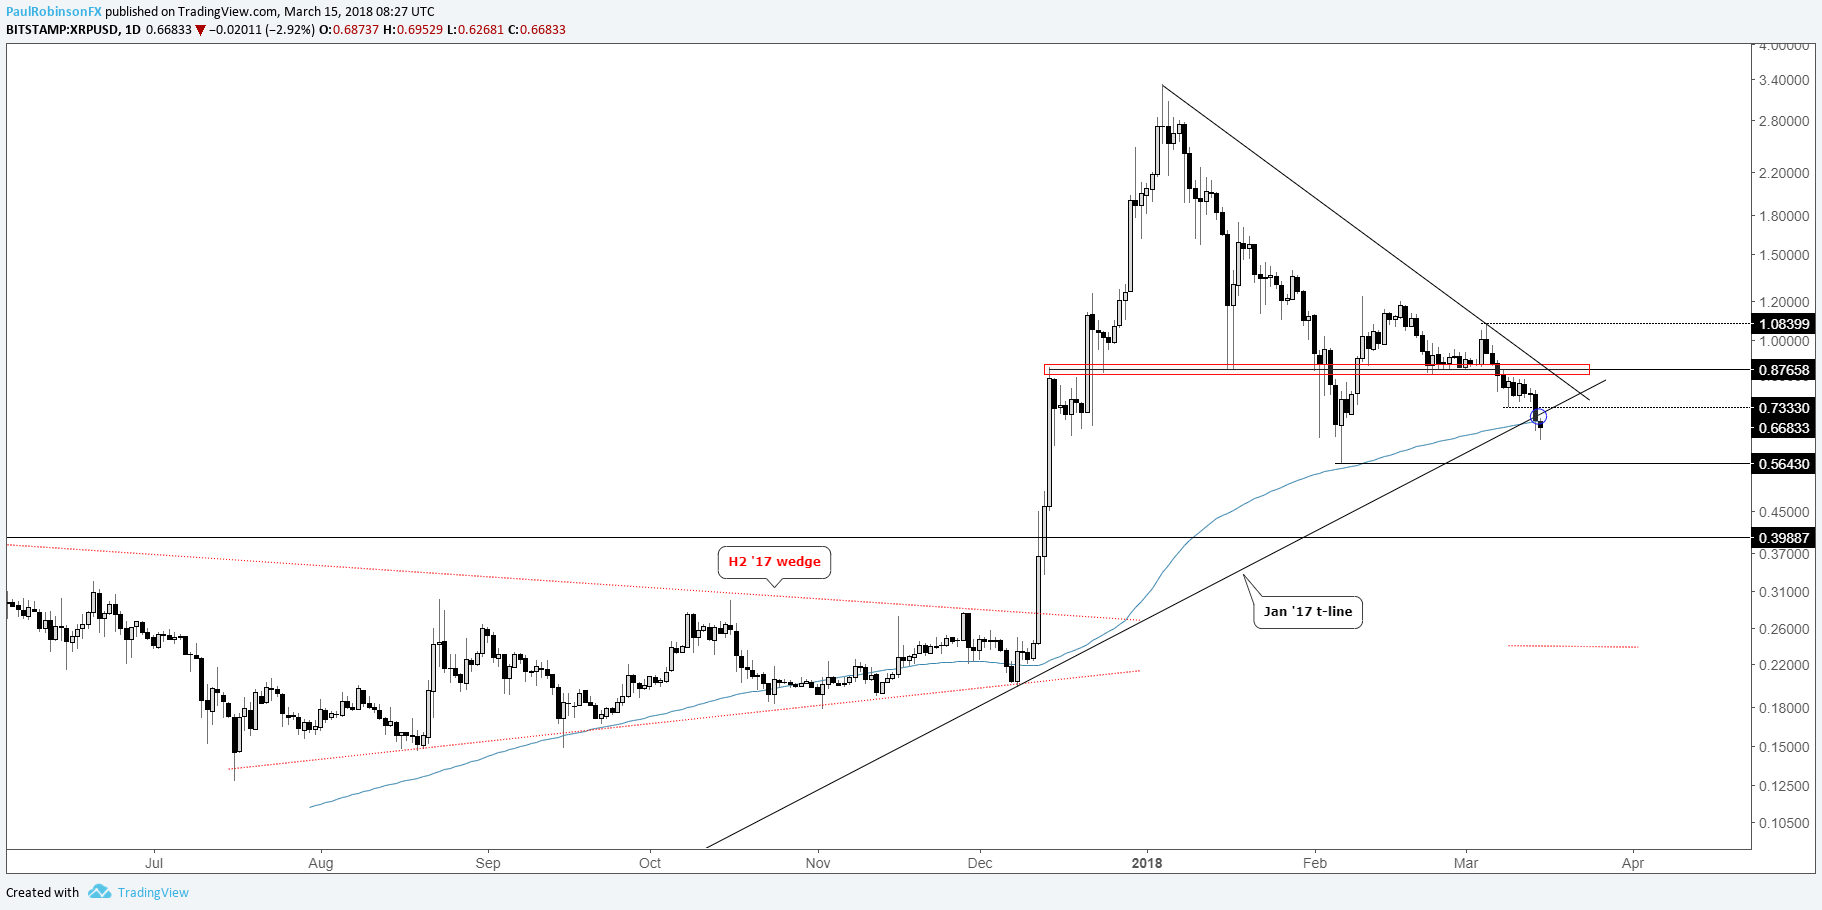
Ripple breakdown has 40 cents, then 25 cents in sights
This morning, Ripple is creeping below the Jan 2017 trend-line and 200-day MA (in confluence with one another). This has the Feb low at 56 cents at risk, and below that point nothing until 40 cents, the May high. Similar to Ethereum, further damage to the apex of the H2 2017 wedge is targeted, which doesn’t arrive until around 25 cents.
XRP/USD Daily Chart
Resources for Cryptocurrency Traders
Whether you’re a new or experienced cryptocurrency trader, we have several resources to help you;Introduction to bitcoin trading guide, indicator for tracking trader sentiment, and a weekly webinar discussing the latest developments.
---Written by Paul Robinson, Market Analyst
To receive Paul’s analysis directly via email, please SIGN UP HERE
You can follow Paul on Twitter at @PaulRobinsonFX


