


What’s inside:
- Implied volatilities decline sharply, reflecting the holiday trading environment through year-end
- Barring any major headlines this means expectations for volatility need to be tempered
- USD/CAD & NZD/USD have highest relative expectations based on differential between short and intermediate-term implied volatility
Check out the IG Client Sentiment data page to see how retail traders are positioned in key FX-pairs and what it could mean for price direction.
As the year quickly draws to a conclusion market participation is thinning out. This is being reflected in levels of implied volatility in options pricing as they continue to decline. In the absence of any unexpected headlines, traders will want to pare back expectations of major price swings in major FX-pairs and markets. Looking at short-term implied volatilities compared to intermediate-term, USD/CAD and NZD/USD are at the top of the board.
The following table displays implied volatility (IV) for major USD-pairs looking out over the next one-week and one-month periods. We’ve made note of the differentials, which can help shape expectations and/or identify currency pairs where the options market may be mispricing potential price movement. We’ve also outlined projected range-low/high levels looking out over the next week within one-standard deviation of the current spot price. (Theoretically speaking, there is a 68% probability that price will remain within the lower and upper-bounds.)

USD/CAD is the only pair with a positive differential between 1-week and 1-month implied volatility
USD/CAD implied volatility hasn’t declined as precipitously as it has in other pairs, but is still at a muted 6.62%. The differential between one-month/one-week is positive at 0.32%, which isn’t a very high premium but does lead the way for the majors and hint at more potential short-term volatility than others.
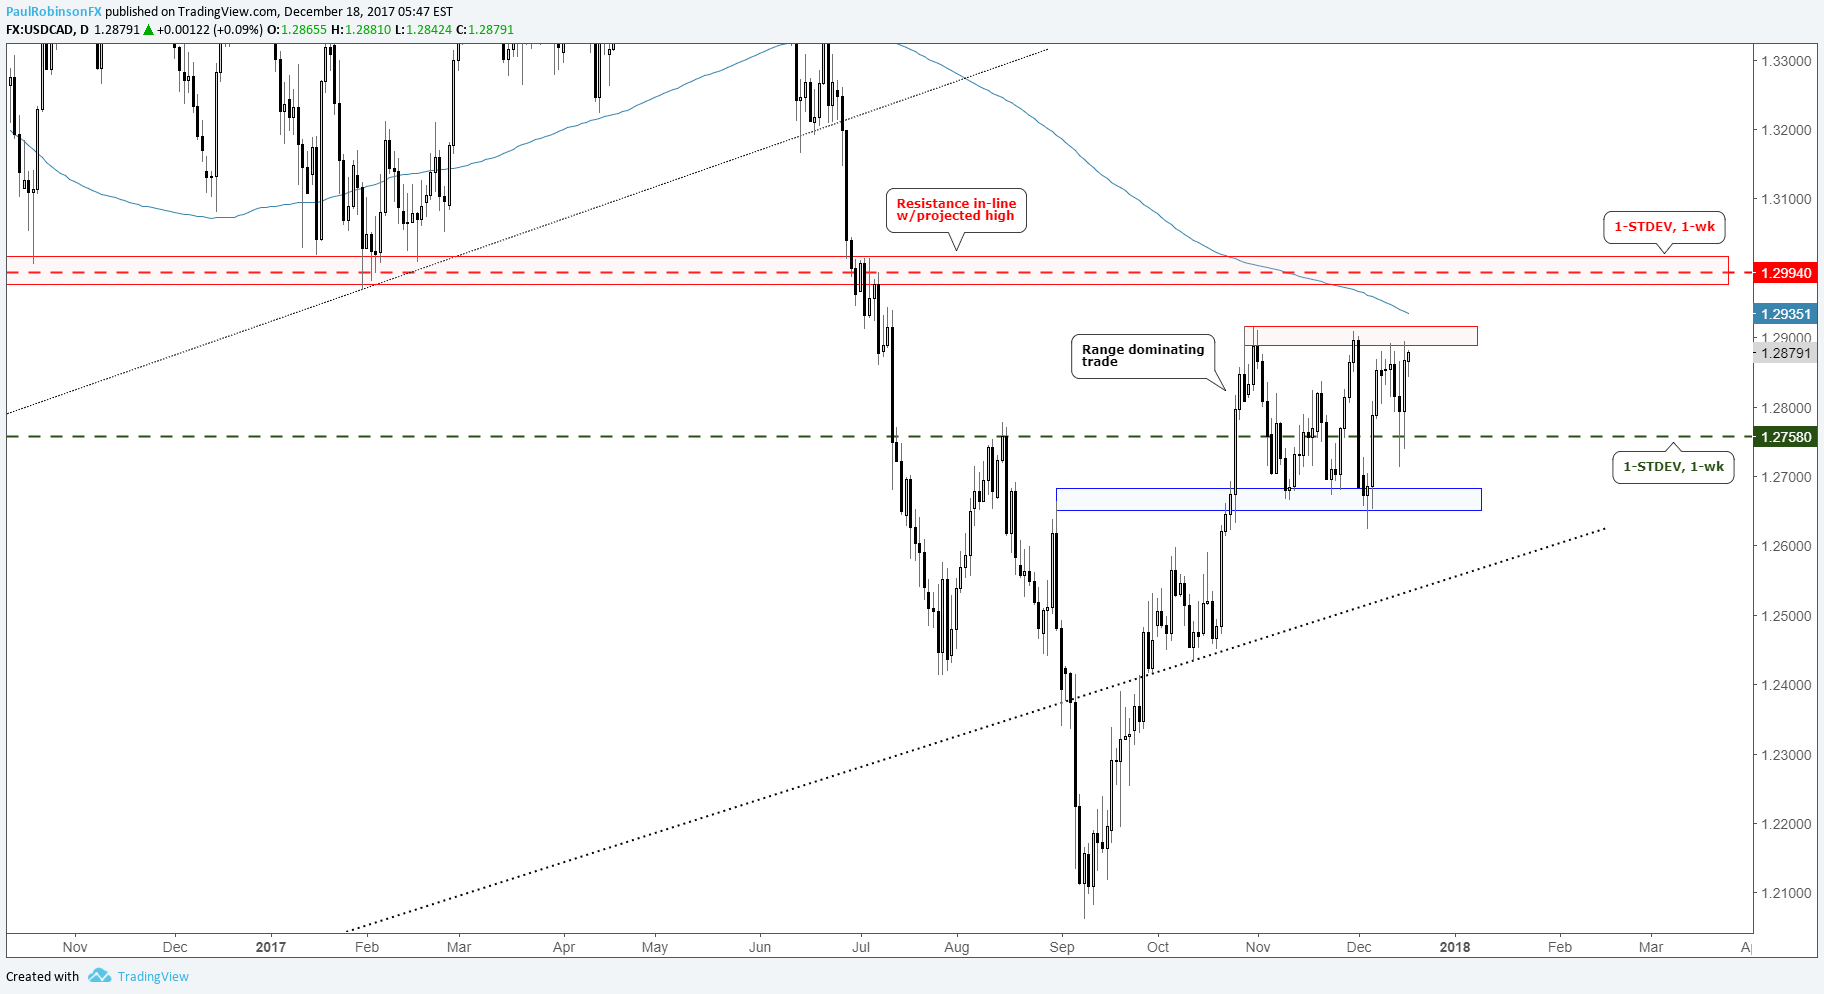
With the trading range in place since the end of October, a breakout may signal an extended move. Strong clearance into the 12900s could snap the range, however; it will quickly bring into play resistance around the 13000-mark. This also happens to be right in the vicinity of the one-week projected high. So, while a range-break may be nearing, its potential could be quickly capped. Looking lower, the projected low is in the middle of the range, and a rejection back lower could see the 12660-area tested once again.
Notable data on the calendar for the week includes a pair of ‘high’ impact data events out of Canada on Thursday and Friday by way of CPI and GDP, respectively. USD risk comes both of those days to in the form of GDP, Core PCE, and Durable Goods Orders. For details, see the economic calendar.
USD/CAD: Daily
NZD/USD continues to hold the highest level of anticipated volatility, but IV has dropped off sharply
One-week implied volatility has dropped sharply as the market is pricing in a holiday-trading environment. Kiwi has held north of 10% implied volatility for quite some time, but at 7.13% one-week IV is now nearing the same levels as other major USD-pairs. This points to smaller price fluctuations, but still leads the pack in terms of anticipated volatility. The one-week projected high at 7075 is of interest as it lies near a confluence of resistance in the form of horizontal levels back to March and the underside of the trend-line extending higher since August 2015. This could be a tough area for the rally to extend through.
On the downside, the projected one-week low doesn’t hold nearly the appeal as support is less meaningful and the overall trend since the summer is still down. But if volatility is to be lacking, it might not take the most meaningful level to keep the downside contained.
There is one ‘high’ impact piece of data coming out of New Zealand this week, when GDP will be released on Wednesday. The U.S. will release GDP on Thursday, followed by Core PCE and Durable Goods Orders on Friday. For details, please refer to the economic calendar.
Now is a good time to reflect on your trading and get ready for the year ahead. We’ve designed Educational Guides to help you with this process.
NZD/USD: Daily

For other currency volatility-related articles please visit the Binaries page.
---Written by Paul Robinson, Market Analyst
To receive Paul’s analysis directly via email, please SIGN UP HERE
You can follow Paul on Twitter at @PaulRobinsonFX


