


Talking Points:
- It’s been a climactic 2017 for Foreign Exchange Markets, and below, we look at six of the more compelling FX cross-pairs as we head towards year-end.
- If you’re looking for forecasts to take you into the end of the year, DailyFX covers a variety of markets such as Euro, Gold and Oil in our Q4 forecasts, available at this link free-of-charge.
As we head towards the end of what’s been a fairly volatile year across the FX space, a number of key themes and scenarios remain interesting as we prepare to turn the page into 2018. While we came into 2017 with the U.S. Dollar in the midst of a screaming up-trend while much of the world waited for parity to print in EUR/USD, a far different tone developed in Q1, and that denominated a fairly unpredictable set of events that drove price action for much of the year.
Probably one of the more surprising occurrences is just how strong the Euro has turned out to be. As global growth continued to show in a rather encouraging manner, and as the ECB remained dovish and passive throughout the year, market participants started to try to get in-front of any potential policy tightening that may eventually take place. While Europe is poised to grow faster than the United States this year, the Federal Reserve has hiked rates four times in the past two years with a fifth just a month away (markets are currently pricing in a 100% probability of a move in December). Meanwhile, as European growth outpaces that of the U.S., the ECB continues with QE at a rather brisk pace. The bank harbors no plans to raise rates or stop reinvesting dividends from their bond buying program, so as we move into next year, there is fairly clear case of potential divergence here. If the global growth story is to continue, the ECB may have some catching up to do in order control inflation, and this can keep FX markets on the move as we turn the calendar into next year.
Below, we’re looking at a number of cross-pairs and one exotic pair that could present some interesting areas of focus as we move towards the end of 2017.
As we came into 2017, there was a very compelling opportunity for divergence between the Euro and the Australian Dollar. We identified this pair as one of our ‘Top Trading Opportunities for 2017’, and this was largely based on the potential for European growth to drive strength into the single currency while continued languish in the Australian economy saw the RBA try to evade the topic of rate hikes altogether.
It took a few months for this theme to come to life, with prices falling closer to our stop-loss in the first quarter of the year. But, it was around the time of the first round of French elections in April that bulls began to populate around the Euro, and it’s been a fairly strong run in the pair ever since. At this stage, we’re trading at fresh one-year highs, but we’re far from out of the woods yet as resistance is continuing to show around a batch of prior swings from May of last year.
Weekly RSI has just made a visit to overbought territory, and this is something that hasn’t happened in the pair since August of 2015. While this does not preclude further gains, it does pose a vexing scenario to traders that might want to try to avoid chasing red-hot markets. One manner of approach would be to wait for a pullback in this longer-term trend before entertaining the addition of bullish exposure.
Prices on the weekly chart are currently finding a bit of support at the 61.8% retracement of the down-trend from the August 2015 high down to the February 2016 low. Just last month we were seeing a considerable amount of build on the under-side of the 50% retracement of the same move. Awaiting a pullback into this area around the 50% level could open the door for bullish exposure while allowing RSI to pose a deeper pullback off of overbought levels.
EUR/AUD Weekly: Bulls in Control but Overbought; Pullback Potential
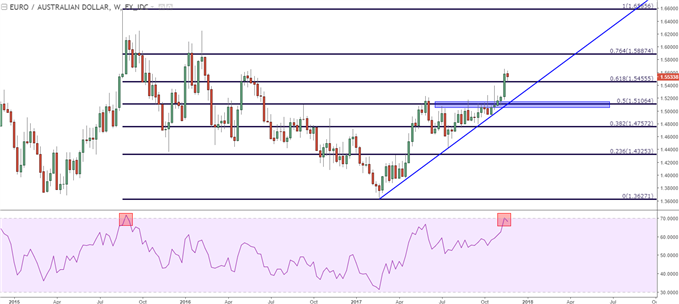
Chart prepared by James Stanley
The 4th quarter of 2017 probably saw more Dollar-Peso traders than at any time before. This was largely driven by the political climate in the United States around a rather contentious election; but all of that interest around the cross-border relationship between the US and Mexico created a plethora of volatility in USD/MXN. And while the headlines around this topic may have quieted a bit of recent, the currency pair has remained on the move.
USD/MXN spent most of July and August building in support around a key Fibonacci level of 17.5385. This is the 61.8% retracement of the March 2015 – January 2017 major move; and the 38.2% retracement of that same setup has helped to offer resistance over the past few weeks. This opens the door for bearish strategies targeting the 50% retracement at 18.3975, with secondary targets available at the prior swing of support around 17.5385.
USD/MXN Weekly: Fibonacci Resistance at 38.2% After Fibonacci Support at 61.8%
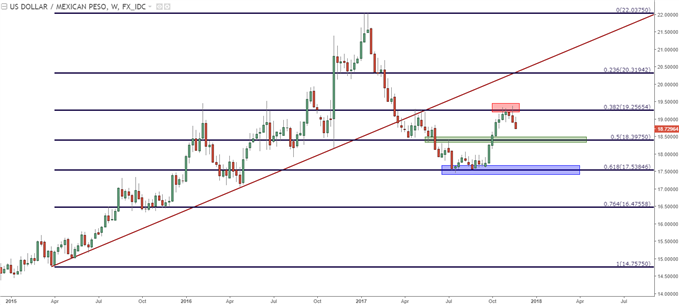
Chart prepared by James Stanley
The third quarter of the year saw some interesting shifts in the dynamics between Australia and New Zealand. While the RBA largely tried to stay behind the headlines this year, New Zealand has seen some considerable change over the past couple of months.
Jacinda Ardern was elected as Prime Minster of the nation in early-August, and matters haven’t really been the same for the New Zealand Dollar since. Ms. Ardern has already floated ideas that could amount to some pretty large changes at the RBNZ, and at this point, we aren’t even sure of who will be leading the bank next year as interim Governor Grant Spencer has only recently taken over for from RBNZ Governor, Graeme Wheeler. A more permanent replacement is expected at some point next year, but by the time we get that name, the RBNZ may have a) an additional mandate of managing employment as well as inflation and b) another governing body assisting with rate policy, as the Reserve Bank Act remains up for debate.
This is a lot of uncertainty and markets, by and large, hate uncertainty. This also presents an opportunity for continued divergence between Australia and New Zealand Dollars, and this can be followed through the AUD/NZD cross-pair.
AUD/NZD has been largely range-bound for most of the past three-and-a-half years. Most of that time has been spent with price action oscillating between 1.0300 and 1.1300 with only a few instances of outliers. But, as recent themes of Kiwi-weakness have begun to show with a bit more prominence, a clean trend has started to show in AUD/NZD inside of this range, and there is the potential for that trend to continue in order to finally resolve almost four years of mean-reversion. Sustained breaks above 1.1300 opens the door for bullish exposure as we move into 2018.
AUD/NZD Weekly: Recent Surge in Bullish Momentum Opens Door to Bullish Breakout Potential
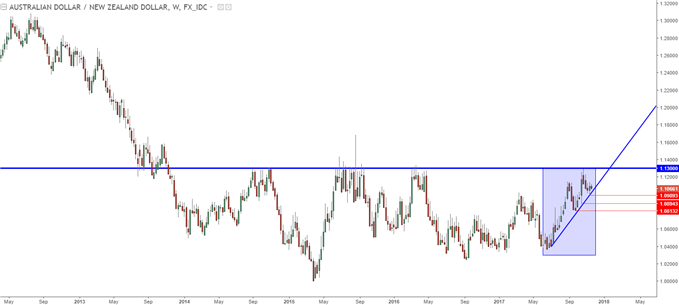
Chart prepared by James Stanley
This is another item for that unexpected category for 2017, but this time it’s not the moves that showed-up that were so surprising, but rather the lack thereof. GBP/JPY has a tendency to be a volatile currency pair, and for many, that is somewhat of the attraction. As we came into 2017, we had the dueling themes of Brexit along with BoJ stimulus that could keep each side of the pair on the move. But matters haven’t worked out that way, and GBP/JPY has spent much of this year moving sideways in a rather choppy manner with a hint of a bullish bias.
2017 price action in GBP/JPY has produced an upward sloping channel. This year’s peak-to-trough range in GBP/JPY has covered 1,726 pips. In 2016, that range was 5,198 pips, and the year before saw 2,100 while 2014 saw 3,199 pips of movement in the pair. So, 2017 has been eerily quiet in GBP/JPY despite the burgeoning themes in both British and Japanese economies, fresh on the heels of a stratospheric-like move after the Brexit referendum.
This type of quiet can lead to aggressive breakouts in such markets, as pent up demand (or supply) breaks through support or resistance before embarking on a directional run that may last for awhile. Traders can look for a break above the 2017 high at 152.86 to open the door for bullish continuation in the pair. Fresh highs can open the possibility of profit targets up to the 159.46 Fibonacci level.
GBP/JPY Weekly: Eerily Quiet 2017 as GBP/JPY Builds into Channel
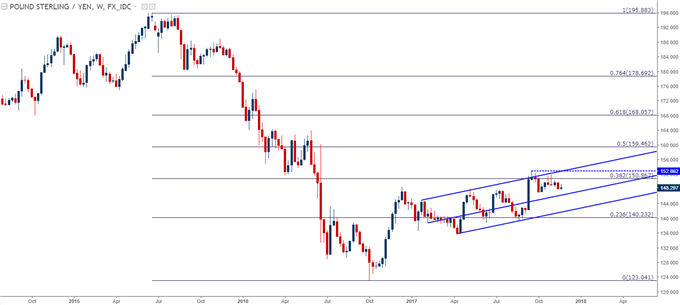
Chart prepared by James Stanley
This is somewhat of a combination of two of the above ideas. As the potential for continued gains in EUR/AUD is very much driven by the dual prospect of Euro strength and Aussie weakness; the potential for the New Zealand Dollar to be even weaker than the Aussie (as we looked at in AUD/NZD) can open the door for topside in EUR/NZD as we move towards year-end.
EUR/NZD just set a fresh two-year high last week, at which point resistance began to show off of the 61.8% retracement of the 2015-2017 major move. Potential support could be sought from the 1.7000 big figure up to the 38.2% retracement of the larger bullish move that showed-up in 2015. A break above current resistance opens the door for a re-test of 1.7880.
EUR/NZD Weekly: Aggressively Bullish Trend Develops After April, Prospects for Continuation
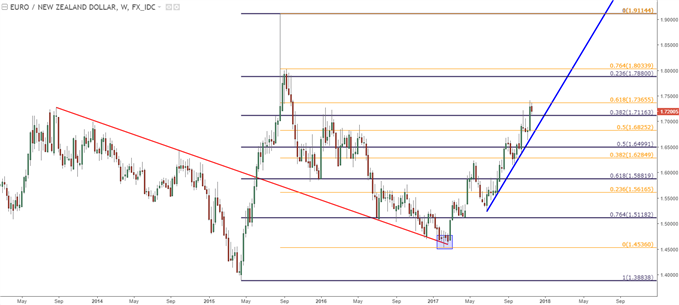
Chart prepared by James Stanley
CAD/JPY put in some considerable strength earlier in the year, and this theme really began to heat up in the summer when the Bank of Canada started talking up the prospect of rate hikes. And this strength was a large reversal of fortune after the brutal two-year span that saw CAD/JPY fall by more than 3,000 pips.
As we came into September, resistance had started to show at the 50% retracement of that two-year down-trend; and after a few weeks of bulls being unable to continue the move-higher, prices have started to pullback. We’re nearing an interesting area of potential support: The August swing-low is around 85.50, while a bullish trend-line intersects with a potential zone of support between 86.93-87.64. Support within this region keeps the door open for bullish continuation as we move towards year-end, and that 50% Fibonacci retracement around the psychological level of 90.00 can be an ideal area to look to manage off risk/move stops to break-even.
CAD/JPY Weekly: 2017 Bullish Trend Pulling Back Towards Confluent Support
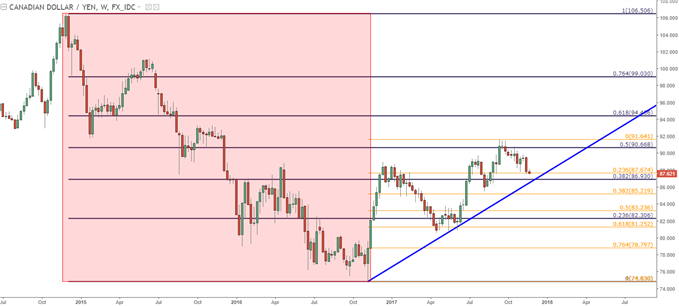
Chart prepared by James Stanley
--- Written by James Stanley, Strategist for DailyFX.com
To receive James Stanley’s analysis directly via email, please SIGN UP HERE
Contact and follow James on Twitter: @JStanleyFX


