


Highlights:
- S&P 500 extending towards long-term target, could mark an important turning point
- EUR/USD firming up after attempting to trade lower; if big resistance ahead breaks looking for ~12400/500
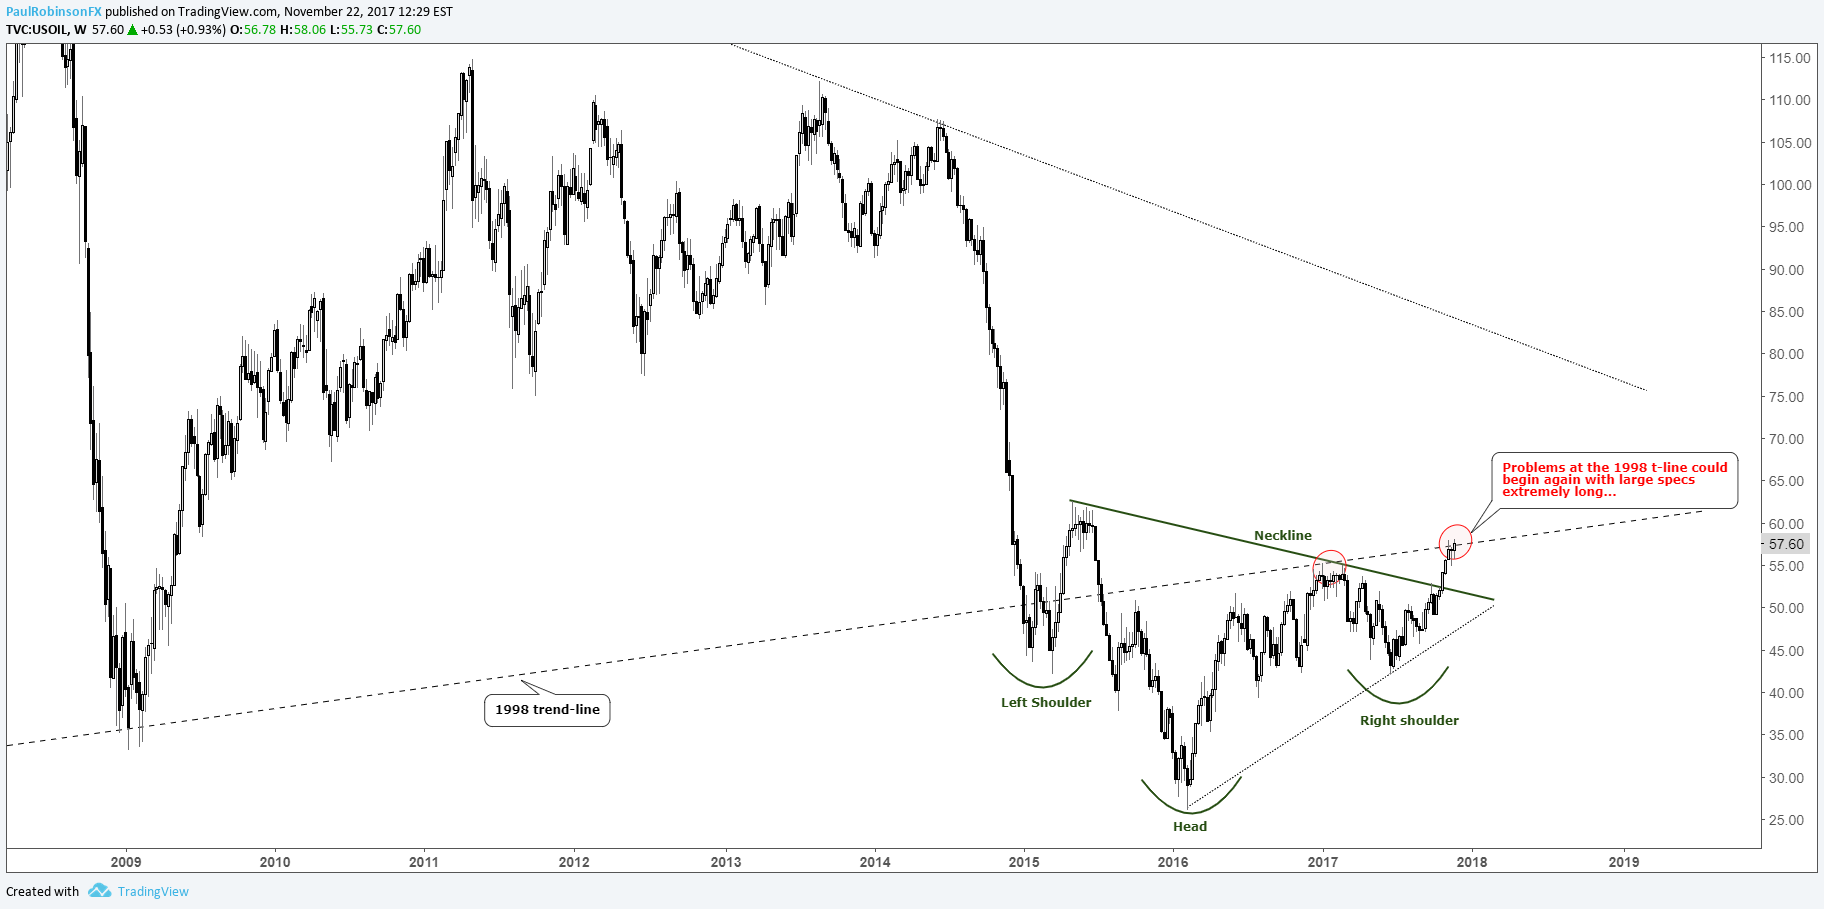
- Crude oil broke the ‘neck-line’ of bottoming pattern, has long-term t-line to overcome; most concerning intermediate-term is overly bullish market positioning
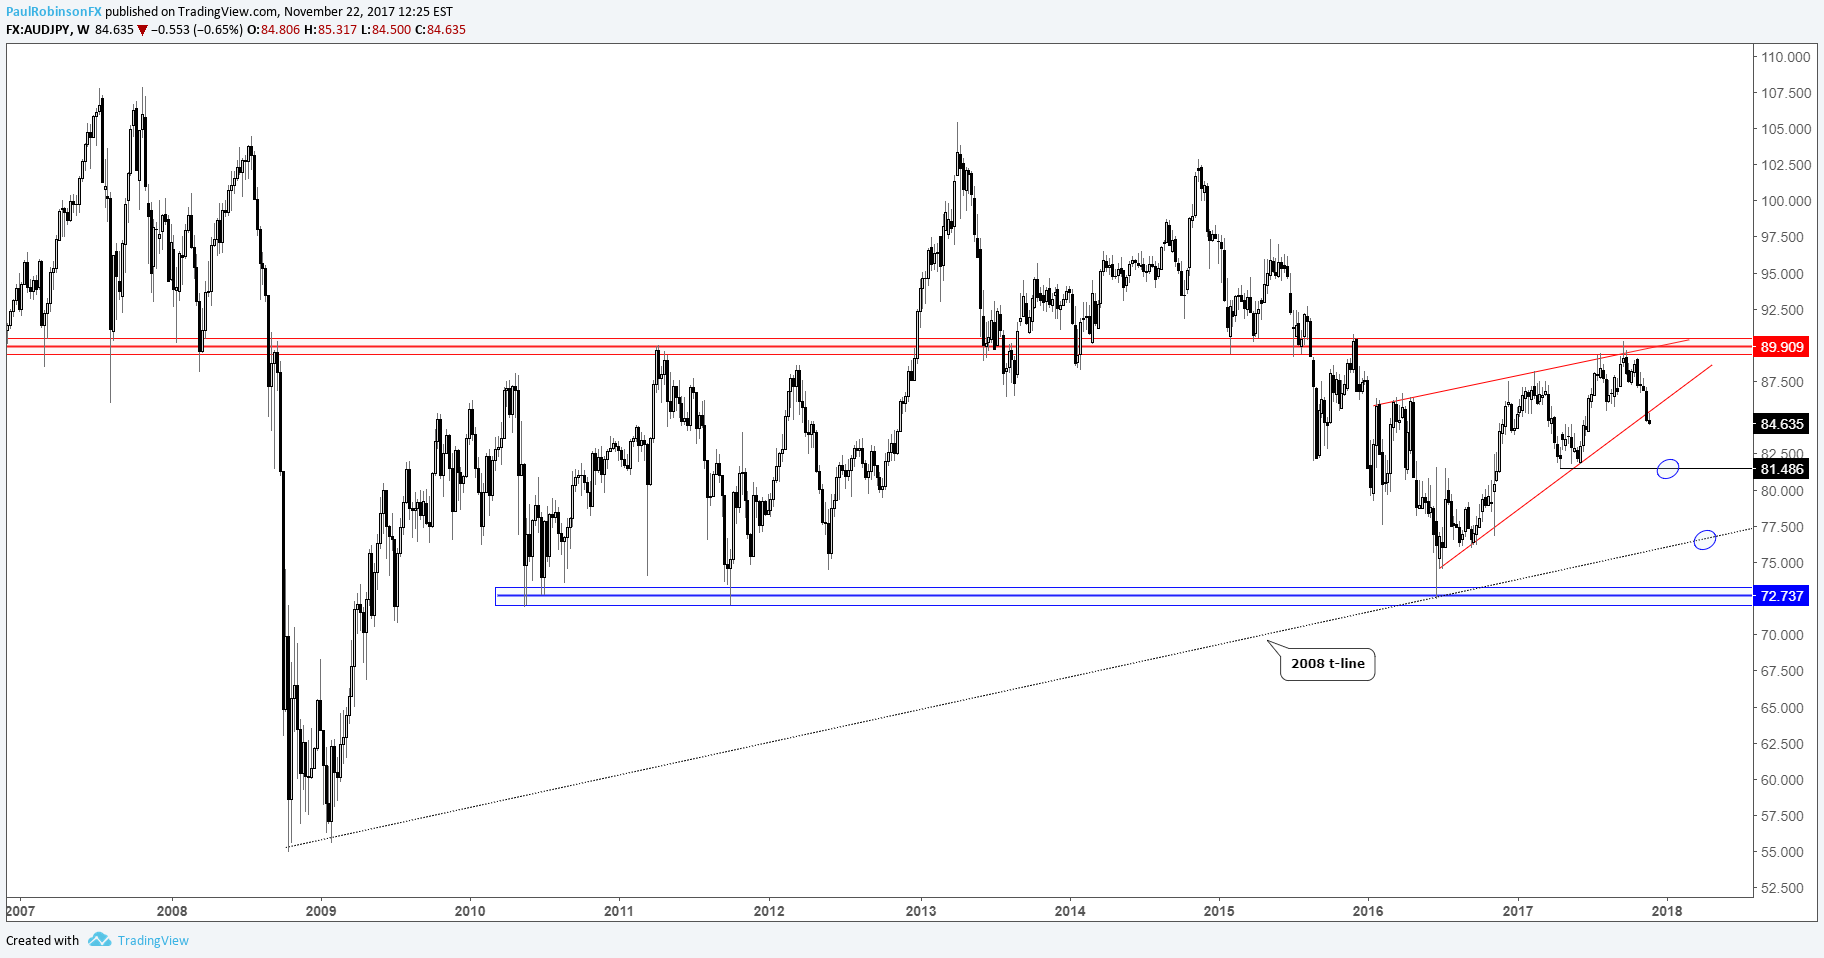
- AUD/JPY technical posturing points to a potential move into the low-72s in coming months
Check out this guide for ideas on how to build confidence in trading
S&P 500 – Nearing the end-zone?
As the S&P 500 continues to extend, trying to find the top is a futile exercise. But identifying spots where a sizable correction (when was the last time we even had one?) could take shape from can help in managing existing long exposure and preparing to operate from the short-side. A top-side target we’ve been waiting on for some time now is closing in. The upper parallel tied to slope off the 2009 low (which has seen a lot of touches over the years) clocks in around 2625. And not all that far above there lies the upper slope to a trend-line rising up off the 2016 low. Should we get to those levels and the market begin to struggle, and it could for a while (tops are often more of a process than bottoms), we could finally be in for weakness om equities which amounts to more than just a 2-3% sell-off. It’s likely the market keeps a bid of some sort through year-end with the help of favorable seasonality, but once the calendar flips it becomes a different story. Also worth noting is that it appears we are in the 5th and final wave of the move off the 2009 low, so the depth of a decline could be something more meaningful than anything we’ve seen in years.
S&P 500: Weekly

EUR/USD – Has eyes for new highs and more
We were recently looking at the euro through a bearish lens as it snapped the ‘neckline’ of a ‘head-and-shoulders’ top, but shortly after the breakdown it found support. The single-currency is currently in the process of putting to restthe bearish implications of the ‘H&S’ top. This is what we had to say last month regarding the developing ‘H&S’: “If it'sto eventually trade much higher, broadly speaking, that a move lower may be truncated and not reach the end-target.” The extent of the move lower, though, was admittedly much smaller than what is considered ‘truncated’, as the euro barely broke the ‘neckline’. A further drop into support down into the 11400s is still possible,but looks a lot less likely at this point. For now, as long as the recent swing-low at 11554 holds (preferably above 11700) EUR/USD may be ready to soon make a run at year high around the 2012 low and higher. Crossing through the year-high would open up a path towards the trend-line running down off the 2008 high which, depending on the timing, will arrive in the vicinity of 12400/500.
EURUSD: Weekly

CRUDE OIL – Price action constructive, overly bullish market positioning isn’t
At the end of September, we looked at a the big-picture possibility that oil could be on the verge of breaking out of a large inverse ‘head-and-shoulders’ formation. The recent breakout of the pattern implies that once there is definitive clearance above the underside of the 1998 trend-line we could see a strong rally. However, even on a convincing break there is hesitation in chasing the trend until there is an alleviation of overly bullish sentiment. Large speculators have recently added at a furious pace to their net-long position, pushing it to a new record (+596k contracts). Historically, these types of surges in position-size, especially into record territory, are cause for a pause if not an outright reversal as market participants run out of buying power. Large trend-followers have clearly become ‘bulled up’, but it may be time for some of that excess bullishness to get worked off through either a time or price correction before thinking about oil resuming higher.
For the fundamental outlook on these markets, check out the DailyFX Trading Forecasts
Crude Oil: Weekly
Large Speculator Positioning

AUDJPY – Looks headed for a big drop
This cross-rate is at risk of firmly breaking a trend-line rising up from mid-2016 which constitutes the bottom-side of a wedge. A clean break points to a move towards several significant lows formed since 2010 in the vicinity of 7350/200. Support along the way comes in at 8149, then the 2008 trend-line in the upper-78s. Should AUD/JPY hold a bid and rally, there is substantial resistance near 90 which could be another spot to look for sellers to step in, while a more developed wedge takes shape.
AUDJPY: Weekly
To hear Paul’s short-term views on the market, see the Webinar Calendar for details.
---Written by Paul Robinson, Market Analyst
You can receive Paul’s analysis directly via email by signing up here
You can follow Paul on Twitter at @PaulRobinsonFX


