


What’s inside:
- USD/JPY one-week implied volatility at 7.3%, may be underpriced
- We could be in for a spat of volatility in the days ahead on stock market weakness
- Projected levels based on IV may be exceeded; a look at where those are relative to price levels
What drivers are expected to move the FX market through the end of the year? Check out the DailyFX Q4 Forecasts.
In the table below, we’ve listed implied volatility (IV) levels for major USD-pairs looking out over the next one-week and one-month periods. Also noted are the differentials between the two, which can help shape expectations and/or identify currency pairs where the options market may be under or over-pricing potential price movement in the short-term. Also outlined, are derived range-low/high prices from the current spot price within one-standard deviation of the current spot price for the one-week time-frame. (In theory, there is a 68% probability that price will remain within the lower and upper-bounds.)
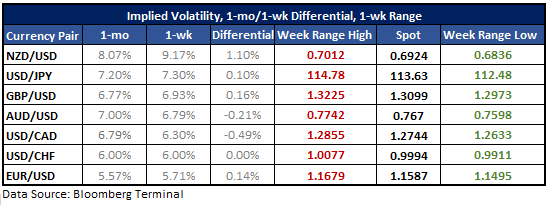
USD/JPY one-week implied volatility is at a low 7.3%, but up from near its worst level of the year around 6.4%. However, it is still far from the yearly high over 11%. The teetering nature of USD/JPY along with a topping formation in the S&P 500 could mean we are in for general stock market weakness and yen strength. This morning, we looked at a bearish price sequence (rising wedge) developing in the world’s largest equity market. Should it lead to a decline, as it currently suggests, then stock market volatility will rise and with it a rise in volatility across other markets, and this case, most importantly, the yen. At this juncture, any uptick in volatility will be a welcomed event for traders.
At 7.3%, the projected one-week range high/low for USD/JPY is 11248-11478. Here is where it becomes interesting, there is a developing wedge situation with the September 2016 trend-line hanging over tops since September and the trend-line off the October low. The compression in price has been recently reflected in the decline in options pricing. Volatility goes from low to high and back again, round and round. A break in the even shorter-term rising wedge in stocks is likely to break USD/JPY free from its own developing pattern as well. If this is the case, the 11248 projected low looks likely to be exceeded relatively quickly. The next big area of support arrives below that threshold around the 11150/75 area, where we have price support back to November of last year and the 200-day MA.
What traits are found in successful traders? Find out in this Trading Guide.
USD/JPY: Daily

Let’s suppose this turns out to be incorrect, there is confluence of resistance just ahead (which is also part of the reason for a bearish outlook). If the triple confluence (bottom of Sep ’16 t-line, May-July highs, and Aug ’15 t-line) is cleared with conviction, it would also be a break of the projected high at 11478. This would be an important breakout and likely lead to some decent top-side momentum, and thus prove implied volatility to be underpriced.
But it appears, again, the former bearish scenario is more likely to happen given all considerations between how the not only USD/JPY is postured but the stock market as well. If this turns out to be the case, the bearish EUR/JPY trade set-up outlined earlier this morning is likely to swing into motion, along with the rest of yen-crosses coming under pressure.
For other currency volatility-related articles please visit the Binaries page.
---Written by Paul Robinson, Market Analyst
You can receive Paul’s analysis directly via email by signing up here.
You can follow Paul on Twitter at @PaulRobinonFX.


