


What’s inside:
- EURUSD one-day implied volatility at 11.13%, implies 1-stdev range of 11685-11821
- German CPI due out at 12 GMT time, US GDP at 12:30
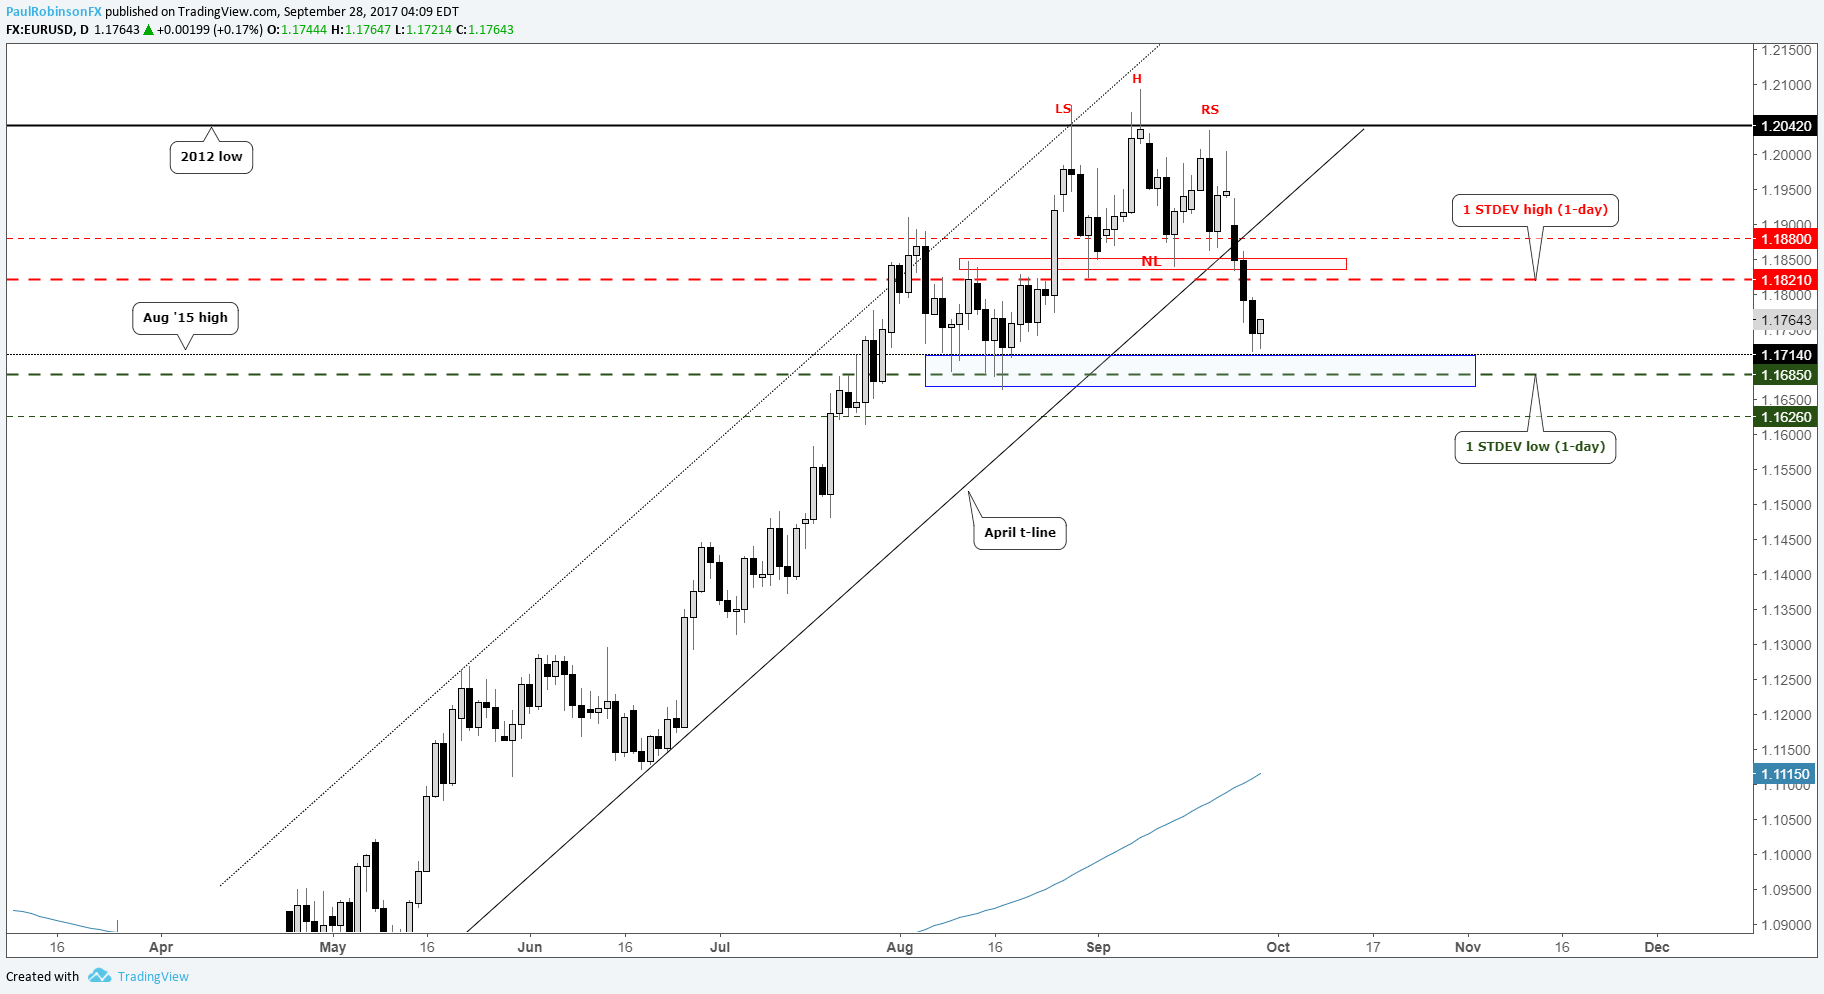
- Projected daily range-low clocks in near key support, high at resistance
The importance of trading psychology can’t be understated. Check out this beginner’s guide – Building Confidence in Trading.
In the following table, you’ll find implied volatility (IV) levels for major USD-pairs looking out over the next one-day and one-week time-frames. Using these levels, we’ve derived the range-low/high prices from the current spot price within one-standard deviation for specified periods. Statistically speaking, there is a 68% probability that price will remain within the lower and upper-bounds.
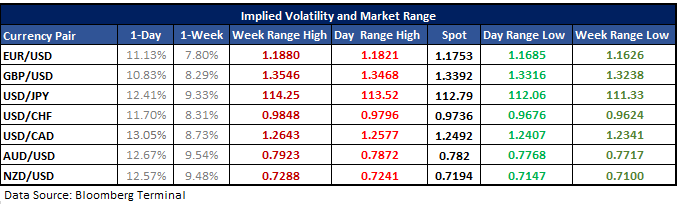
EURUSD one-day implied volatility steady ahead of key data releases, projected range-low in alignment with key support
Later today at 12:00 GMT time, we have German CPI due out for September with expectations for it to remain unchanged from August at 1.8% YoY. Just 30 minutes later, Q2 U.S. GDP is expected to be confirmed at 3%. Turning to the options market, one-day implied volatility is relatively tame as today’s data isn’t expected to cause any substantial volatility, but should we see anything significantly outside of expectations then that can change in a hurry.
The daily range calculated from current spot price within one-standard deviation stands at 11685-11821. Of particular interest in terms of where these levels lie on the chart from a technical standpoint, is the projected range-low and solid support just under the 11700-handle. We’ve seen a fairly sizable decline in recent sessions from the ‘head-and-shoulders’ (H&S) pattern, but in the short-term selling could be overdone. Should we see a move lower today into the area just under 11700 down to ~11662 we may see buyers step in, with an attempt to bounce to follow. On the top-side the one-day projected high of 11821 aligns with the ‘neckline’ (NL) of the H&S formation. The area around 11825 has been tested on numerous occasions and could prove to be problematic if the single-currency is to continue moving lower.
For other currency volatility-related articles please visit the Binaries page.
EURUSD: Daily
Join Paul live each week; for details please see the Webinar Calendar.
---Written by Paul Robinson, Market Analyst
You can receive Paul’s analysis directly via email by signing up here.
You can follow Paul on Twitter at @PaulRobinonFX.


