


What’s inside:
- USDCAD one-week implied volatility at 7%, projects 1 STDEV range of 12446-12690
- Top-side looks unlikely to be exceeded with trend favoring more selling
- Confluence of projected low and July low; risk highest for IV to rise on a breakdown
Looking for a longer-term view on USDCAD? Check out our Q3 Forecast.
In the following table, we’ve listed implied volatility (IV) for major USD-pairs for the next one-day and one-week time periods. Using IV, the projected range-low/high prices from the current spot price within one-standard deviation have been calculated for specified periods. (Statistically speaking, there is a 68% probability that price will remain within the lower and upper-bounds.)
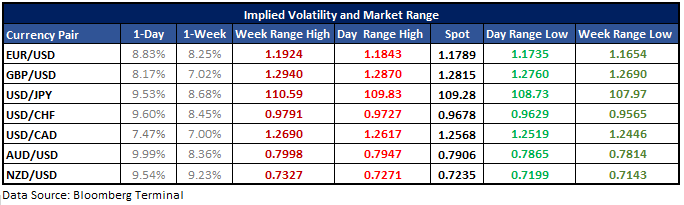
USDCAD one-week implied volatility a subdued 7%, suggests a small range with the projected 1 STDEV low in confluence with key support
One-week implied volatility in USDCAD at a level of 7% suggests a one-standard deviation range of 12446 to 12690 over the next five trading sessions. It’s a fairly small range, and one which could certainly be exceeded. But when looking at where key price levels align in proximity to these projected levels implied volatility may turn out to be priced right.
Looking higher we have minor trend-line resistance which arrives just below the projected one-week high of 12690. The overall trend suggests a push higher may require more fire-power than what is currently available in the absence of a significant catalyst (No strong CAD data next few days, Yellen at Jackson Hole on Friday will be the primary focus). On that note, seeing the 1 STDEV high exceeded doesn’t look highly likely.
Turning the focus lower, there is pretty good support around the one-week projected low at 12446. This level aligns well with the low created at the end of July. It was a volatile low which saw several days of lows ticked within about 20 pips of one another. On a first attempt to push lower from here we may see USDCAD find some life at key support, even if it is to eventually break lower. But giving the trend the benefit of the doubt, should we see a decline accelerate as it approaches the July low then risk is the market isn’t pricing in enough downside risk. The next support level to keep an eye on if the July low at 12413 breaks, is the 2012 trend-line arriving about 60-70 pips lower.
All-in-all, implied volatility looks to be priced about right, with the highest risk of a breakout coming on the downside with a breach of the July low.
For other currency volatility-related articles, please visit the Binaries page.
USDCAD: Daily

See the Webinar Calendar for a schedule of upcoming live events with DailyFX analysts.
---Written by Paul Robinson, Market Analyst
You can receive Paul’s analysis directly via email by signing up here.
You can follow Paul on Twitter at @PaulRobinonFX.


