


What’s inside:
- USDCAD amid strongest decline since early last year
- 2012 to current trend-line not far below, in alignment with projected one-week low
- Top-side range-high not in alignment with resistance; could be exceeded on a bounce
Looking for a longer-term view on USDCAD? Check out our Q3 Forecast.
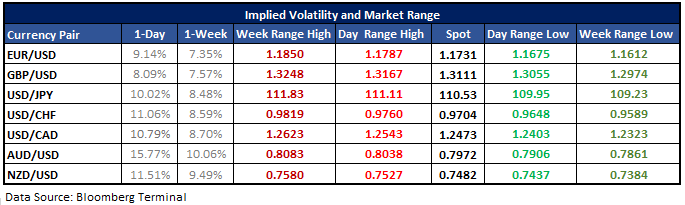
In the following table, we’ve listed implied volatilities (IV) for major USD-pairs looking out over a one-day and one-week time horizon. By using IV, we’ve calculated the projected range-low/high prices from the current spot price within one-standard deviation for specified periods. (Statistically speaking, 68% of the time price should remain within the lower and upper-bounds.)
USDCAD projected one-week low in alignment with long-term trend-line
The decline in USDCAD has been quite significant since topping in May, the strongest one-way move since early 2016. With one-week implied volatility at 8.7%, the projected one-standard deviation range from the current spot price is 12323 to 12623. The one-week low arrives in almost exact alignment with a trend-line rising up from the low created in September 2012. The long-term nature of this line coupled with the steep drop into oversold territory sets USDCAD up for a potential bounce.
It’s possible we have already seen the worst for now around the May 2016 low, but one more push down into a bigger support level would provide a more ideal scenario for those looking for a recovery. With the priced range in confluence this further strengthens the case we have seen the worst of the down-move for now.
Turning our attention higher, the one-week projected high clocks in at 12623 and doesn’t align with any significant resistance. Should we see a rally develop soon its possible we may see the options-derived threshold exceeded in the next week, as shorts who arrived on the scene late get squeezed.
In total, while selling has been fierce, a move lower into support looks likely to see the range-low hold while risk is skewed towards possibly seeing the range-high exceeded.
For other currency volatility-related articles please visit the Binaries page.
USDCAD: Daily

See the Webinar Calendar for a schedule of upcoming live events with DailyFX analysts.
---Written by Paul Robinson, Market Analyst
You can receive Paul’s analysis directly via email by signing up here.
You can follow Paul on Twitter at @PaulRobinonFX.


