


- The US Dollar trades at pivotal levels versus the Japanese Yen – next move is key
- Further Euro weakness seems likely, but outlook for the GBP, AUD, and NZD is less clear
- See more information on DailyFX on the Real Volume and Transactions indicators
Receive the Weekly Volume at Price report via David’s e-mail distribution list.
The US Dollar trades at pivotal price levels versus the Japanese Yen, while the Euro looks likely to decline further. Here are the levels we’re watching.
Total Buy Volume Executed, Total Sell Volume Executed, Net Volume Executed (Buy-Sell)
Length of bar indicates the sum of Buy and Sell volume.
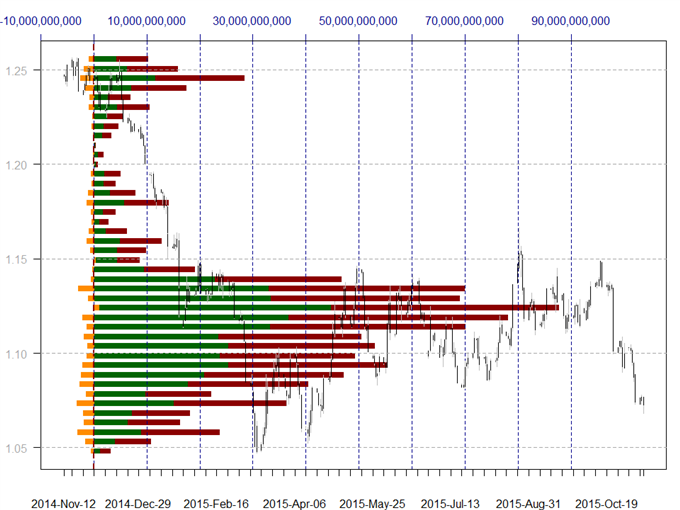
Data source: FXCM Real Directional Volume Indicator, Chart source: R. Prepared by David Rodriguez
The Euro has broken through all meaningful levels of volume-based support versus the US Dollar, and risks remain for a return to multi-year lows near the $1.05 mark. Resistance now stands at former support near $1.08, but we would need to see a break above more substantive volume-based resistance levels starting at $1.10 to call for a larger EUR rebound.
Total Buy Volume Executed, Total Sell Volume Executed, Net Volume Executed (Buy-Sell)
Length of bar indicates the sum of Buy and Sell volume.

Data source: FXCM Real Directional Volume Indicator, Chart source: R. Prepared by David Rodriguez
The US Dollar trades near fairly significant volume-based resistance versus the Japanese Yen at ¥123.50, and a break higher would leave little in the way of further rallies into decade-plus highs near ¥126. Yet a failure to close above said level would turn focus towards clear volume and price-based congestion surrounding the ¥121 and especially ¥120.
The significance of near-term USD/JPY support and resistance levels suggests it may once again act as a bellwether for the US Dollar; a major breakout or breakdown would likely coincide with a shift in the USD across the board.
Total Buy Volume Executed, Total Sell Volume Executed, Net Volume Executed (Buy-Sell)
Length of bar indicates the sum of Buy and Sell volume.

Data source: FXCM Real Directional Volume Indicator, Chart source: R. Prepared by David Rodriguez
The British Pound trades at potentially significant volume and price-based congestion versus the US Dollar surrounding the $1.5150 mark. Yet a failure to hold above these levels would leave little comparable support until the psychologically-significant $1.50 handle and notable volume-based support closer to $1.49. Near-term resistance starts at volume and price-based congestion around $1.5250 and $1.5350.
Total Buy Volume Executed, Total Sell Volume Executed, Net Volume Executed (Buy-Sell)
Length of bar indicates the sum of Buy and Sell volume.

Data source: FXCM Real Directional Volume Indicator, Chart source: R. Prepared by David Rodriguez
The Australian Dollar remains within a broad, choppy trading range versus the US Dollar, and recent momentum suggests that an AUD/USD test of major support at $0.7000 is likely. Failure to hold above would leave little in the way of a move to five-year lows near $0.6900 and eventually the March, 2009 trough closer to $0.6300. Near-term resistance is well-defined at volume/price congestion surrounding $0.7200.
Total Buy Volume Executed, Total Sell Volume Executed, Net Volume Executed (Buy-Sell)
Length of bar indicates the sum of Buy and Sell volume.

Data source: FXCM Real Directional Volume Indicator, Chart source: R. Prepared by David Rodriguez
The US Dollar trades at key volume and price-based congestion versus the Canadian Dollar surrounding C$1.3200, and a break higher leaves little in the way of multi-year highs near C$1.3450. Support is now former resistance at the top of a major USD/CAD volume-based congestion range of C$1.3100.
NZDUSD
Total Buy Volume Executed, Total Sell Volume Executed, Net Volume Executed (Buy-Sell)
Length of bar indicates the sum of Buy and Sell volume.

Data source: FXCM Real Directional Volume Indicator, Chart source: R. Prepared by David Rodriguez
The New Zealand Dollar remains narrowly below key volume and price-based resistance in the $0.6550-0.6600 range, and a continued hold below leaves short-term focus on comparable support closer to $0.6400. A break higher would instead shift near-term targets to multi-month highs near $0.6900.
--- Written by David Rodriguez, Quantitative Strategist for DailyFX.com
Receive the Weekly Volume at Price via David’s e-mail distribution list.
Contact David via
Twitter at http://www.twitter.com/DRodriguezFX


