


- Euro and Japanese Yen poised to slide versus US Dollar
- Forex volatility prices remain elevated, favoring big currency swings
- See more information on DailyFX on the Real Volume and Transactions indicators
Receive the Weekly Volume at Price report via David’s e-mail distribution list.
The US Dollar remains in control versus the Euro and Japanese Yen. Here are the key levels we’re watching.
Total Buy Volume Executed, Total Sell Volume Executed, Net Volume Executed (Buy-Sell)
Length of bar indicates the sum of Buy and Sell volume.
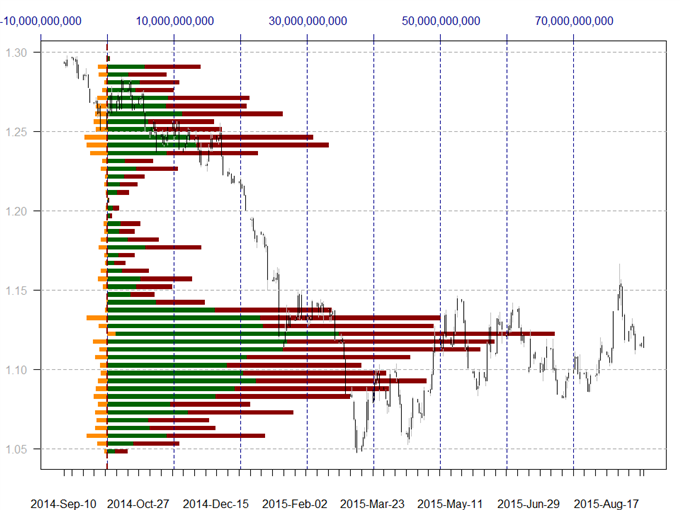
Data source: FXCM Real Directional Volume Indicator, Chart source: R. Prepared by David Rodriguez
The Euro trades below key congestion levels at $1.12, and risks remain to the downside unless we see a significant move above the important price level. The psychologically significant $1.10 level remains the next logical target, while notable price and volume-based congestion near $1.09 offers subsequent support.
Total Buy Volume Executed, Total Sell Volume Executed, Net Volume Executed (Buy-Sell)
Length of bar indicates the sum of Buy and Sell volume.

Data source: FXCM Real Directional Volume Indicator, Chart source: R. Prepared by David Rodriguez
The British Pound has broken major volume-based support versus the Dollar and now trades notable congestion at the $1.54 mark. Risks remain to the downside on a failure to move above short-term resistance, and subsequent support is seen at recent spike-lows/volume-based support near $1.5150.
Total Buy Volume Executed, Total Sell Volume Executed, Net Volume Executed (Buy-Sell)
Length of bar indicates the sum of Buy and Sell volume.
Data source: FXCM Real Directional Volume Indicator, Chart source: R. Prepared by David Rodriguez
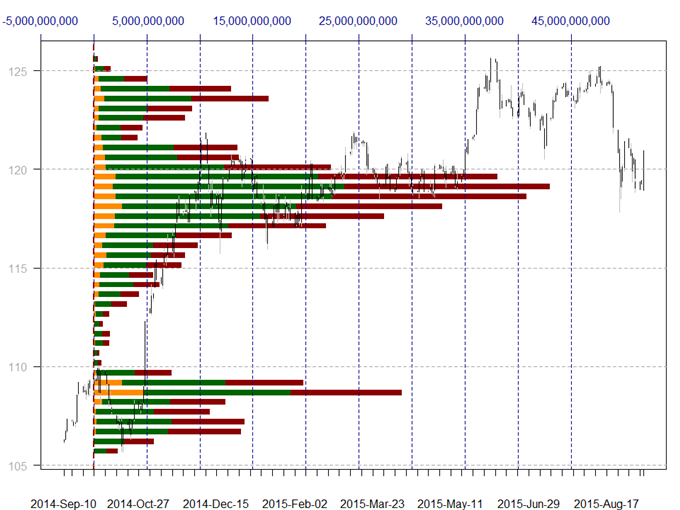
The US Dollar continues to hold substantial volume-based support versus the Japanese Yen near the ¥119 mark, and trading above keeps focus on near-term technical resistance at the recent reaction high of ¥121.60. A break above sees little in the way of substantial resistance until considerable volume-based congestion near ¥123.50.
Total Buy Volume Executed, Total Sell Volume Executed, Net Volume Executed (Buy-Sell)
Length of bar indicates the sum of Buy and Sell volume.

Data source: FXCM Real Directional Volume Indicator, Chart source: R. Prepared by David Rodriguez
The Australian Dollar trades slightly above the psychologically significant $0.7000 versus the US Dollar, and a continued hold above leaves short-term focus on volume and price-based congestion resistance near $0.7150. Further breakdown nonetheless targets a move towards recent lows of $0.6900 as overall momentum favors AUD/USD declines.
Total Buy Volume Executed, Total Sell Volume Executed, Net Volume Executed (Buy-Sell)
Length of bar indicates the sum of Buy and Sell volume.

Data source: FXCM Real Directional Volume Indicator, Chart source: R. Prepared by David Rodriguez
The Euro has broken below fairly significant volume and price-based congestion support at ¥135 versus the Yen, and short-term focus remains on multi-month lows near ¥132.50. Recent support is now resistance at ¥136, and risks seem weighed to the downside given recent Euro losses across the board.
Total Buy Volume Executed, Total Sell Volume Executed, Net Volume Executed (Buy-Sell)
Length of bar indicates the sum of Buy and Sell volume.

Data source: FXCM Real Directional Volume Indicator, Chart source: R. Prepared by David Rodriguez
The US Dollar continues to consolidate within a notable volume-based congestion range of C$1.30-1.3300 against the Canadian Dollar, and slowed price gains warn that overall price momentum could reverse. The psychologically-significant C$1.3000 marks important support, and a break below would see little comparable volume support until C$1.2750.
NZDUSD
Total Buy Volume Executed, Total Sell Volume Executed, Net Volume Executed (Buy-Sell)
Length of bar indicates the sum of Buy and Sell volume.

Data source: FXCM Real Directional Volume Indicator, Chart source: R. Prepared by David Rodriguez
The New Zealand Dollar has bounced sharply versus the US Dollar and now trades at recent price congestion near $0.6400. A break higher would shift focus to significant volume-based resistance starting at $0.6500 and extending through $0.6650, while further breakdown would make recent spike-lows of $0.6250 the next logical target.
--- Written by David Rodriguez, Quantitative Strategist for DailyFX.com
Receive the Weekly Volume at Price via David’s e-mail distribution list.
Contact David via
Twitter at http://www.twitter.com/DRodriguezFX
http://www.fxcmapps.com/trading-station/directional-real-volume/?CMP=SFS-70160000000NbT3AAK


