


- US Dollar pulls back sharply at key resistance levels versus Euro
- $1.12 now represents major resistance for EUR/USD, $1.5650 for the GBP/USD
- See more information on DailyFX on the Real Volume and Transactions indicators
Receive the Weekly Volume at Price report via David’s e-mail distribution list.
The US Dollar has pulled back sharply versus the Euro and other major currencies. Here are the next levels we’re watching.
EURUSD
Total Buy Volume Executed, Total Sell Volume Executed, Net Volume Executed (Buy-Sell)
Length of bar indicates the sum of Buy and Sell volume.
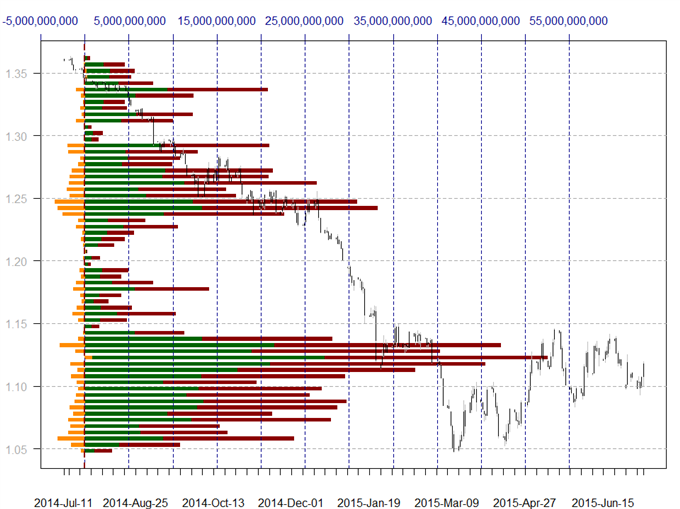
Data source: FXCM Real Directional Volume Indicator, Chart source: R. Prepared by David Rodriguez
A sharp rebound in the Euro leaves it trading just short of key volume-based resistance starting at $1.12, and we would need a sustained break above to change our overall calls for continued declines. Further resistance would be seen at June highs and a large buildup in volume above $1.14, while support is now the recent spike-low near $1.10.
GBPUSD
Total Buy Volume Executed, Total Sell Volume Executed, Net Volume Executed (Buy-Sell)
Length of bar indicates the sum of Buy and Sell volume.

Data source: FXCM Real Directional Volume Indicator, Chart source: R. Prepared by David Rodriguez
The British Pound has bounced sharply off of recent lows and congestion support near $1.54, and further resistance is now seen at a major volume-based congestion level near $1.5650. Support remains near $1.54.
Total Buy Volume Executed, Total Sell Volume Executed, Net Volume Executed (Buy-Sell)
Length of bar indicates the sum of Buy and Sell volume.

Data source: FXCM Real Directional Volume Indicator, Chart source: R. Prepared by David Rodriguez
The US Dollar recently broke below key volume-based support near ¥121.50 but bounced back sharply to trade near notable congestion in the ¥123.50-¥124.50 range. Support remains near recent lows.
Total Buy Volume Executed, Total Sell Volume Executed, Net Volume Executed (Buy-Sell)
Length of bar indicates the sum of Buy and Sell volume.

Data source: FXCM Real Directional Volume Indicator, Chart source: R. Prepared by David Rodriguez
The Australian Dollar recently broke down below all notable volume-based support levels, but a continued hold above recent lows near $0.7400 marks support for the fast-falling currency. Notable resistance starts at major volume and price congestion levels at approximately $0.7550 and extends through $0.7800.
Total Buy Volume Executed, Total Sell Volume Executed, Net Volume Executed (Buy-Sell)
Length of bar indicates the sum of Buy and Sell volume.

Data source: FXCM Real Directional Volume Indicator, Chart source: R. Prepared by David Rodriguez
The Sterling has found notable support versus the Japanese Yen at congestion starting near ¥188. Focus now turns to volume-based congestion levels just above ¥190, while recent lows now mark support.
Total Buy Volume Executed, Total Sell Volume Executed, Net Volume Executed (Buy-Sell)
Length of bar indicates the sum of Buy and Sell volume.

Data source: FXCM Real Directional Volume Indicator, Chart source: R. Prepared by David Rodriguez
The Euro has rebounded sharply off of lows near ¥134 and now trades at notable volume-based resistance near ¥137. Trading above would leave further price resistance at ¥138, while the psychologically significant ¥140 mark would be the next logical target.
Total Buy Volume Executed, Total Sell Volume Executed, Net Volume Executed (Buy-Sell)
Length of bar indicates the sum of Buy and Sell volume.

Data source: FXCM Real Directional Volume Indicator, Chart source: R. Prepared by David Rodriguez
The US Dollar has failed to trade above important volume-based resistance of SFr0.9500 versus the Swiss Franc, and attention now turns to important congestion near 0.9300. Trading below leaves 0.9200 as the next near-term target.
Total Buy Volume Executed, Total Sell Volume Executed, Net Volume Executed (Buy-Sell)
Length of bar indicates the sum of Buy and Sell volume.

Data source: FXCM Real Directional Volume Indicator, Chart source: R. Prepared by David Rodriguez
The US Dollar has consolidated near post-financial crisis highs of C$1.2800 versus the Canadian Dollar, and failure to trade above leaves focus on major volume-based support starting near the $1.2600 mark.
NZDUSD
Total Buy Volume Executed, Total Sell Volume Executed, Net Volume Executed (Buy-Sell)
Length of bar indicates the sum of Buy and Sell volume.

Data source: FXCM Real Directional Volume Indicator, Chart source: R. Prepared by David Rodriguez
The New Zealand Dollar traded below all notable volume-based support levels has also broken July, 2010 lows near $0.6800, but the pair has most recently stopped and reversed just above the $0.6600 mark. Former support now becomes resistance at $0.6800, and to the downside we see the May, 2010 trough of $0.6550 as the next key price floor.
--- Written by David Rodriguez, Quantitative Strategist for DailyFX.com
Receive the Weekly Volume at Price report via PDF via David’s e-mail distribution list.
Contact David via
Twitter at http://www.twitter.com/DRodriguezFX


