


- High Frequency Trading Insights Dashboard offers access to tools previously unavailable
- Unique insights into current market conditions
- Proprietary GridSight Index (Gix ™) calculates historical probability of continued price move
See the High Frequency Trading Insights dashboard via this link
There is no shortage of trading tools, technical indicators, and other analysis techniques available to forex traders. But much of this is repetitive and does little to answer a key question—what can I view to help me decide whether the current market move will continue? The FXCM High Frequency Trading Market Insights tool looks to bridge that gap by offering the trader access to information and trading insights previously available to only the most sophisticated professional investors.
The service offers a real-time look at real trading volumes, market liquidity, positioning, and most importantly a summary to help make sense of it all. Are traders buying or selling into the current Euro tumble, and does it matter? Does institutional supply and demand line up with the recent rally in the British Pound? These are the types of questions we look to answer via our new offering.
See the High Frequency Trading Insights dashboard via this link
- What is the FXCM High Frequency Trading Market Insightsservice?
The FXCM High Frequency Trading Market Insights service is a highly-advanced system which monitors 30 high-frequency market signals centered around Institutional Liquidity, Professional Supply and Demand, and Retail Trading Activity. It shows these in real-time in order to help establish whether conditions favor a continuation in current price momentum.
- How could I use it with my trading?
The FXCM High Frequency Trading Market Insights service comes in two parts: the Market Insights Dashboard and High Frequency Insights summary. In the Market Insights Dashboard we can see key details previously unavailable to non-professional traders as we observe parent company FXCM’s real-time data on Trading Volume, Institutional Liquidity, Institutional Supply and Demand, and Retail Trading Activity. Each of these factors gives a bullish or bearish signal on current market conditions and gives clues as to whether we can expect price will continue in its current direction or reverse.
Retail Volume tells us in real-time how active retail traders have been via FXCM’s Execution desk data. Higher activity helps identify significant market moves.
Provided Liquidity monitors Bid/Ask liquidity as made available via our Professional price providers. Higher liquidity often highlights important levels of professional trader interest.
Supply/Demand measures the relative balance of Institutional Liquidity. Are professional price providers active on the Bid—signaling buying interest? We can see this number at a glance.
Trading Activity shows us the balance of retail trader activity. Have traders bought aggressively into the recent decline or sold? Based on other key factors this helps highlight important levels.
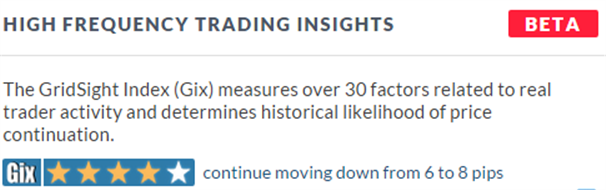
The High Frequency Insights section shows the GridSight Index—Gix for short—which calculates the historical likelihood that price will continue higher or lower after its initial move. Past performance is not indicative of future results, but using these tools in tandem a trader gives access to key indicators and analytics previously reserved for only sophisticated professional traders.
- How do I tell if it is a strong or weak signal? Should I ignore weak signals?
The Gix™ will show a rating of 1-5 stars to show how historically likely it has been for price to continue in one direction or another.
- Current conditions are not similar to historical price moves.
- Current conditions are somewhat similar to historical price moves.
- Current conditions are very similar to historical price moves.
Past performance is not indicative results, but the system is set up to continuously set the strength of its ratings based on recent market developments and price movements.
- What type of trader should use these signals?
Any trader can monitor the alerts in real-time, but we expect that higher-frequency traders and scalpers will find it more useful in their minute-to-minute trading analysis.
- What are the five main factors used in the Gix calculation?
These are Price Action, Retail Trading Volume, Institutional Liquidity, Institutional Supply/Demand, and Retail Trader Positioning.
- What is the timeframe of the Gix ™ rating?
The Gix™ will measure the historical likelihood that price will continue in the current direction in two pip intervals. Past performance is not indicative of future results, but this should give some confidence in the strength of the current market move. Depending on current market volatility, this may represent less than a second’s worth of price action or several minutes.
- What risk management should I use? Should I use wider stops and limits with different star ratings?
As with any trade idea, we use this tool in addition to existing strategy and risk parameters. We always recommend taking trades with a minimum of 1:1 Reward/Risk—look to gain at least as much as you have to lose. (See our Traits of Successful Traders series article for more on this.)If the Gix™ signal coincides with your own trading system pointing to buy or sell, you may set a stop loss and a limit order at least the same distance from entry.
- Are Email/Text Alerts available?
We believe that the signals are of too-high a frequency to make SMS or e-mail alerts feasible.
- How often is the star rating updated? Does it move between stars in Real time?
The star rating is re-evaluated in real-time, but we aim to have the star rating update no more than once per minute.
See the High Frequency Trading Insights dashboard via this link
Past performance is not an indicator of future performance.
Insight provided does not constitute trading advice.


