


Talking Points:
- US30 (DOW) failure on breakout could lead to a sharp breakdown
- The psychology of an ascending triangle failure
- If a bearish breakout occurs, a 1200 point move lower is possible….
Is the breakout to new all-time highs in U.S. blue chip names cause for concern? It will be if certain developments begin to play out soon. Volatility has been low, complacency has set into a market where complacency looks as if it should be replaced with heightened alertness. Today, I am only going to take a look at one particular pattern in one index, however; there are multiple macro developments which at the very least raise caution flags that the entire ‘risk-trade’ could soon come under pressure. I recently went into greater detail on the subject – read here for more. Soon, I will revisit the topics in that article with some additions.
The US30 (DOW) has been coiling up into a wedge since the beginning of the year. Traders across all asset classes have felt this constriction in volatility, as price swings in everything from stocks to rates to commodities to FX have become increasingly smaller. To see that, all one needs to do is look at a daily chart of almost anything with the 10-day ATR indicator plotted at the bottom – average daily swings are dripping lower. The US30 during this triangulating process has witnessed nearly a 45% decline in daily price movement. If the following scenario occurs, it is very likely that bigger, maybe much bigger price movement will return.
On Monday, the US30 broke out to new all-time highs. How exciting, right? Not so fast…that breakout has already failed, for now at least, and we sit just about where we started the year. Why this fascinates me – when triangles, like the one the DOW is stuck in now, breakout and fall back into the pattern, it had better regain breakout levels soon or it is in real risk of breaking out in the opposite direction.
US30 (DOW) – Daily
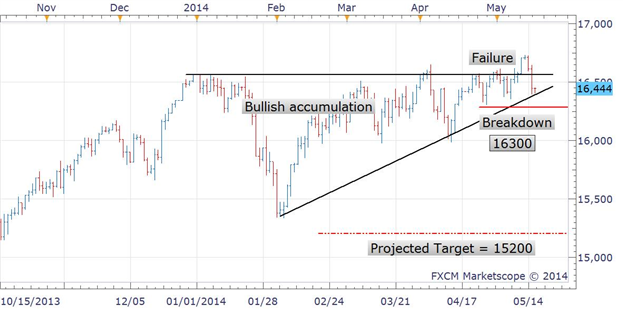
Charts created by Paul Robinson using MarketScope 2.0.
To better understand the workings of this pattern, let’s do a quick overview of the psychology behind it. For several months now, the US30 has been working its way higher creating an ascending triangle, marked by higher lows and same overhead horizontal resistance. This means, buyers have become increasingly willing to buy at higher prices, however, sellers have put a ceiling on this. In time, the idea is that the increasing confidence in the market as a whole (higher lows) will eventually lead to a breakout with overhead resistance being taken out.
However, what happens though when that ceiling is taken out with all signs pointing to go time, but then the market doesn’t follow through and falls back below the breakout price? Well, think about it for a second as if you are the crowd buying this market. How would you (the crowd) feel if you kept buying an asset at higher and higher prices, saw it break out to new highs, only to watch it fail to follow through and fall back into the same old range it has been trading in for months? Perhaps a bit discouraged and nervous? Sure, those are natural feelings in this situation (don’t forget, people move markets based on their perceptions.)
So, now, the asset (US30) is back inside the trading range, you (the crowd) are feeling a bit on the nervous side after your holdings fail to stay above the breakout price. Now, what happens if not only did you just watch your position go from new highs, but starts taking out the price levels you bought at? Confidence quickly diminishes, and more importantly, monetary losses begin piling up, leading you (the crowd) to start selling – this is the kind of stuff that leads to sharp moves.
How sharp? It’s a big pattern measured on months, but as a general rule of thumb the range of triangles is used to determine the target, so in this case the range from high to low dictates approximately a 1200 point move. I am looking for a clean break down below 16300 on a closing basis before becoming aggressively bearish, which also happens to be just 30 points higher than the average price of YTD triangle pattern. Target projection is at 15200. It is still possible for the bulls to take back control, but this failure to breakout puts a shadow of doubt on the bullish picture – something good better happen soon, or something bad could be in the works (for the bulls).
--Written by Paul Robinson of FXSimplified.com


