


British Pound Technical Forecast: Neutral
- It was a tough start to the week for Sterling as GBP/USD pushed down for a fresh 37-year-low.
- Matters weren’t as bearish elsewhere, as GBP/JPY put in a bullish breakout from a symmetrical triangle formation. EUR/GBP pushed up towards range resistance which also remains an item of interest around Euro setups.
- The analysis contained in article relies on price action and chart formations. To learn more about price action or chart patterns, check out our DailyFX Education section.

The big headline for GBP currency markets was that the GBP/USD pair set a fresh 37-year-low this week. But, really, this week was about the 1.1500 handle in Cable. That major psychological level came into play on the prior Thursday and helped to hold the lows on the Friday after. Bears began to push for a breach on Monday of this week and then on Wednesday, were able to force price all the way down to 1.1414. That’s a massive level as that’s the 37-year-low in the pair, set during the initial stages of the pandemic. The last time GBP/USD traded below 1.1414 – until Wednesday – is all the way back in 1985 as the Plaza Accord was coming online.
That low was penetrated by nine pips on Wednesday – with a fresh 37-year low at 1.1405 being set, after which a bounce began to show. From the daily chart below, we can see that defense around the 1.1500 level through much of the past week.
GBP/USD Daily Price Chart

Chart prepared by James Stanley; GBPUSD on Tradingview
GBP/USD Longer-Term
Taking a step back on chart highlights what a significant area that’s currently in-play as support. While this doesn’t necessary preclude bearish continuation, it does make for a more challenging backdrop considering just how aggressively bears have this move over so far in 2022. And there’s a very obvious reason for that given the growing divergence between US and UK monetary policy.
The big question is whether we’re at a spot where bears would be comfortable triggering fresh exposure so near that newly-created 37-year-low. Or – perhaps would a more opportune scenario present itself on a push up to lower-high resistance – which may show around the 1.1750 area that helped to set support in early-July? And if there is an extension of that bounce, there’s another area of interest around the 1.2000 handle, which was previously a massive spot of support-turned-resistance.
GBP/USD Weekly Chart
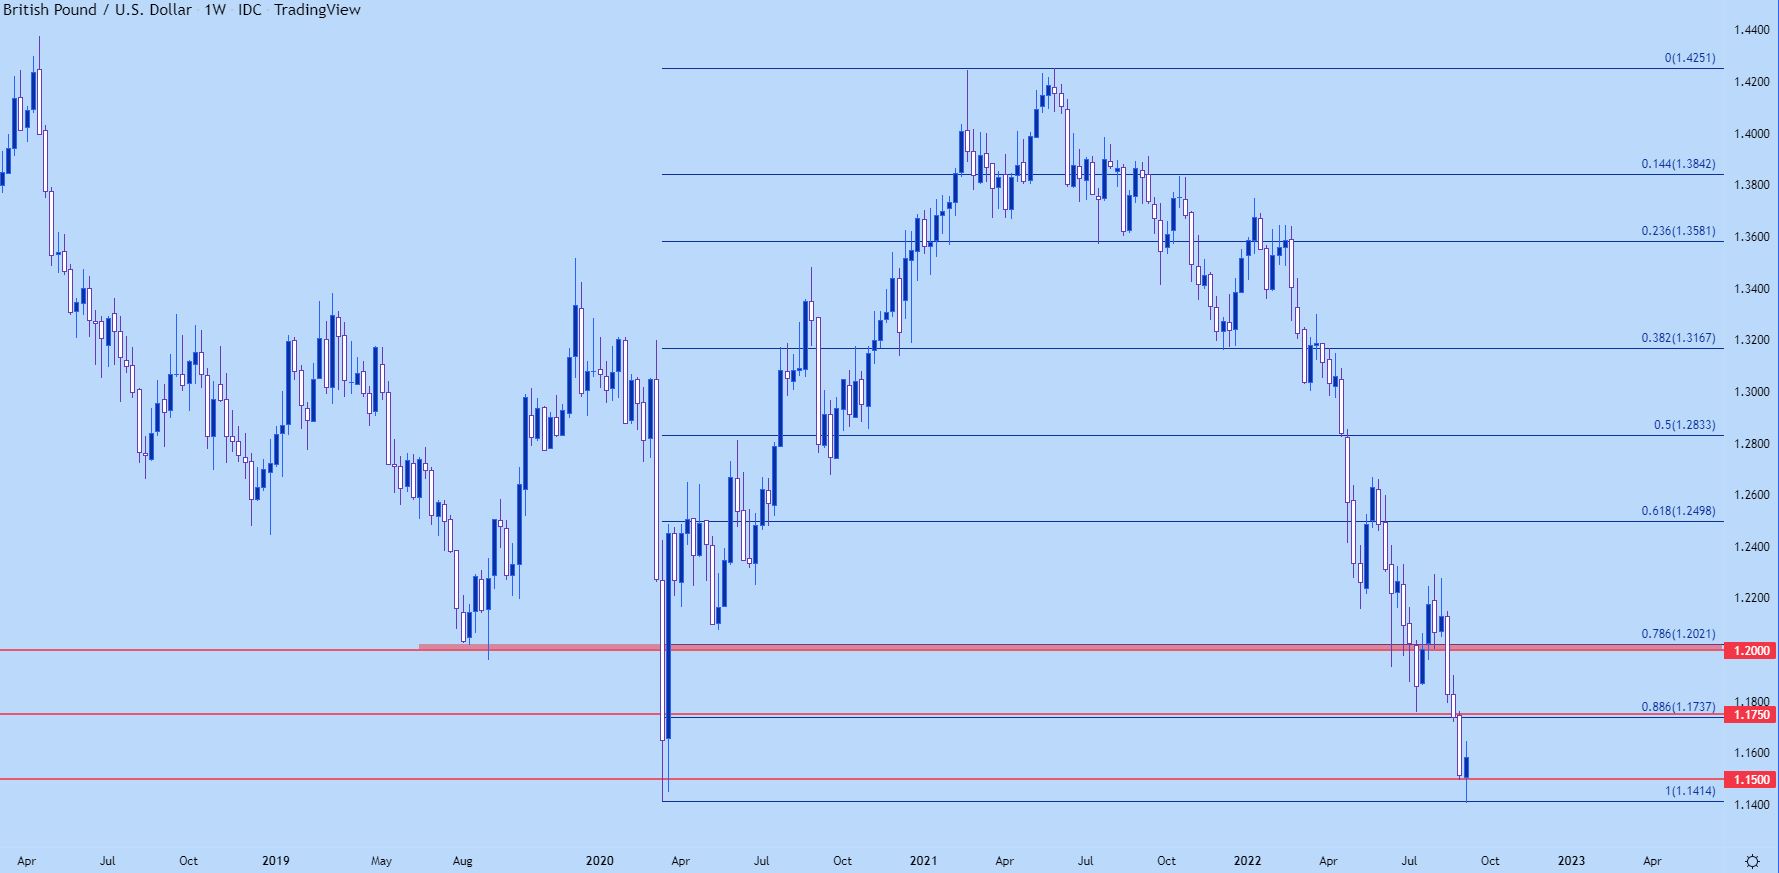
Chart prepared by James Stanley; GBPUSD on Tradingview
GBP/USD Shorter-Term
For next week, the 1.1500 level remains a key point for price action trends. I’m tracking the most recent higher-low at 1.1459 so theoretically we could see a test inside of 1.1500 whilst the bullish potential would remain. But, ideally, if there is going to be more of a reversal to price in, bulls would defend that 1.1500 big figure (or higher) to continue the recent series of short-term higher-highs and higher-lows.

GBP/USD Two-Hour Price Chart

Chart prepared by James Stanley; GBPUSD on Tradingview
GBP/JPY
Getting away from the US Dollar can recalibrate matters a bit, as both Sterling weakness and USD strength have created very stretched theme in the major pair. In GBP/JPY, however, the week started with continued consolidation.
GBP/JPY, a pair known for outsized volatility, so much so that it’s earned the moniker of ‘the dragon’ or ‘the widow maker’ has spent the better part of the past four months building a symmetrical triangle. There was a massive initial range on the formation, with approximately 1,300 pips between initial support and resistance. But, that range narrowed further and further until this week finally led to breakout when the Japanese Yen showed a massive move across the FX market. Notably – GBP/JPY was the last to break out of similar formations when compared to EUR/JPY and AUD/JPY.
The breakout finally took hold on Wednesday and price pushed up to a fresh monthly high, finding resistance at the July high around 166.25. That level held through Thursday and Friday trade.
GBP/JPY Daily Chart
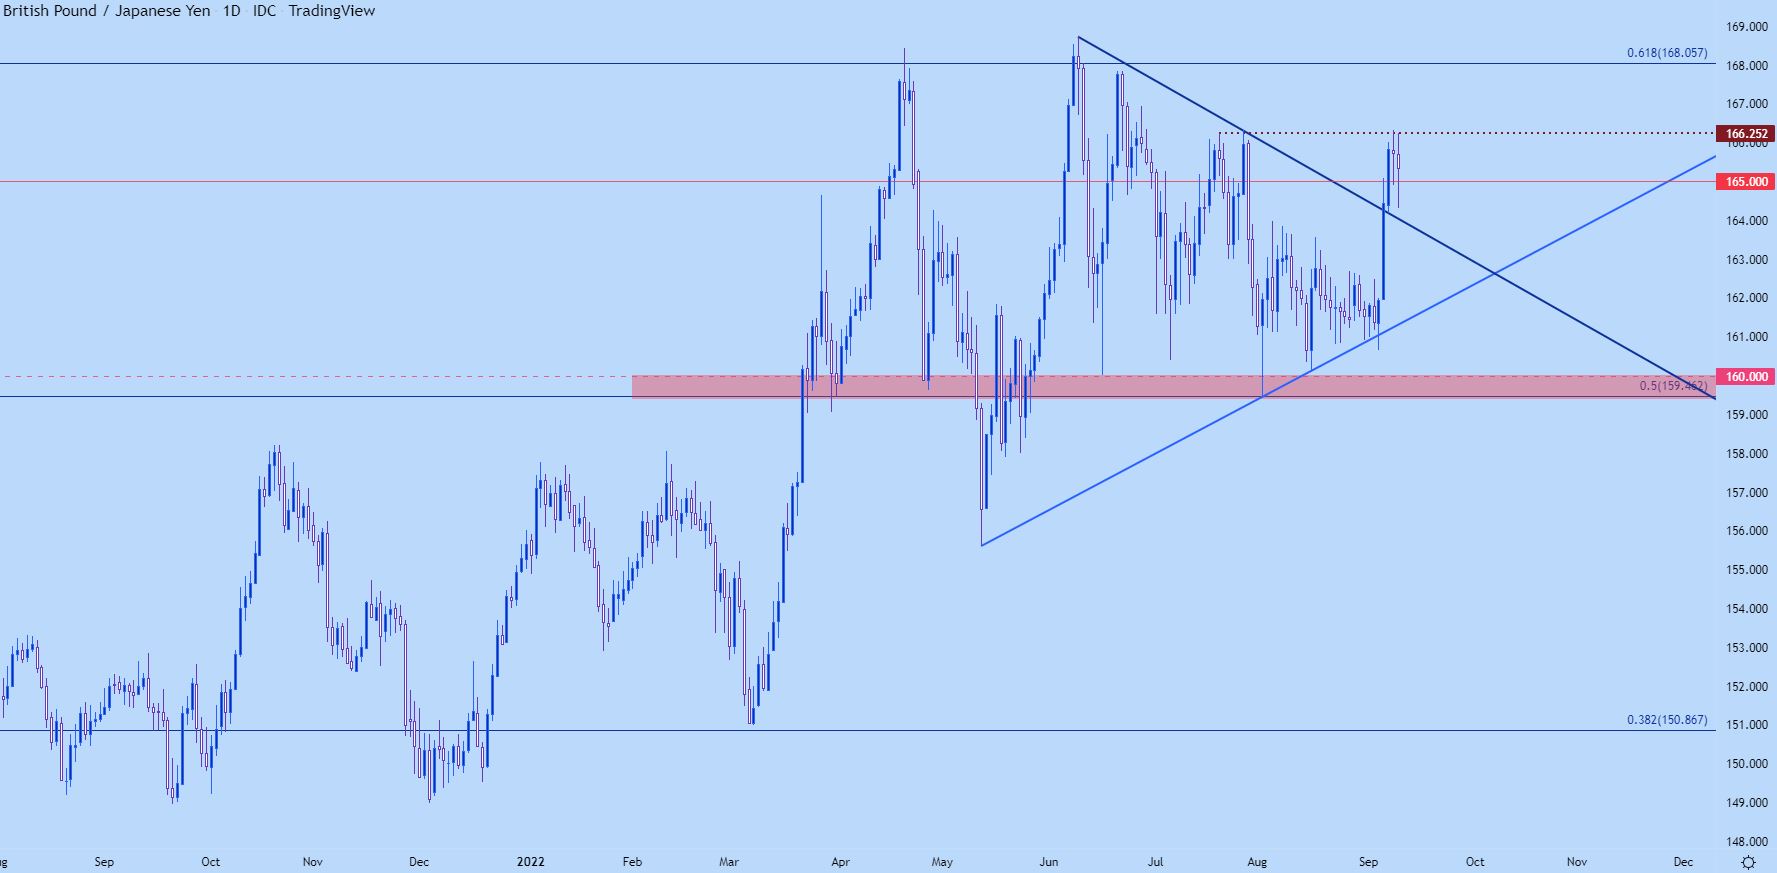
Chart prepared by James Stanley; GBPJPY on Tradingview
GBP/JPY Big Picture
It’s the long-term dynamic that remains important here and this is something that can fast come into play should buyers continue pressing this breakout.
The current six-year-high in GBP/JPY plots at 168.06, which is the 61.8% Fibonacci retracement of the 2015-2016 major move. This level came into play in April and induced a 1300+ pip reversal. It was back in-play in June which led to a more moderate pullback to the 160 area of support (which is confluent with the 50% mark of that same Fibonacci study). This helped to form the basis of the higher-lows that made up that symmetrical triangle.
But, now that bulls have broken through resistance – are we headed for another test of 168.06? And further – will the next test be treated even more kindly than the last, which was treated better than the first? This keeps the door open for longer-term bullish breakout potential in GBP/JPY.
GBP/JPY Weekly Chart
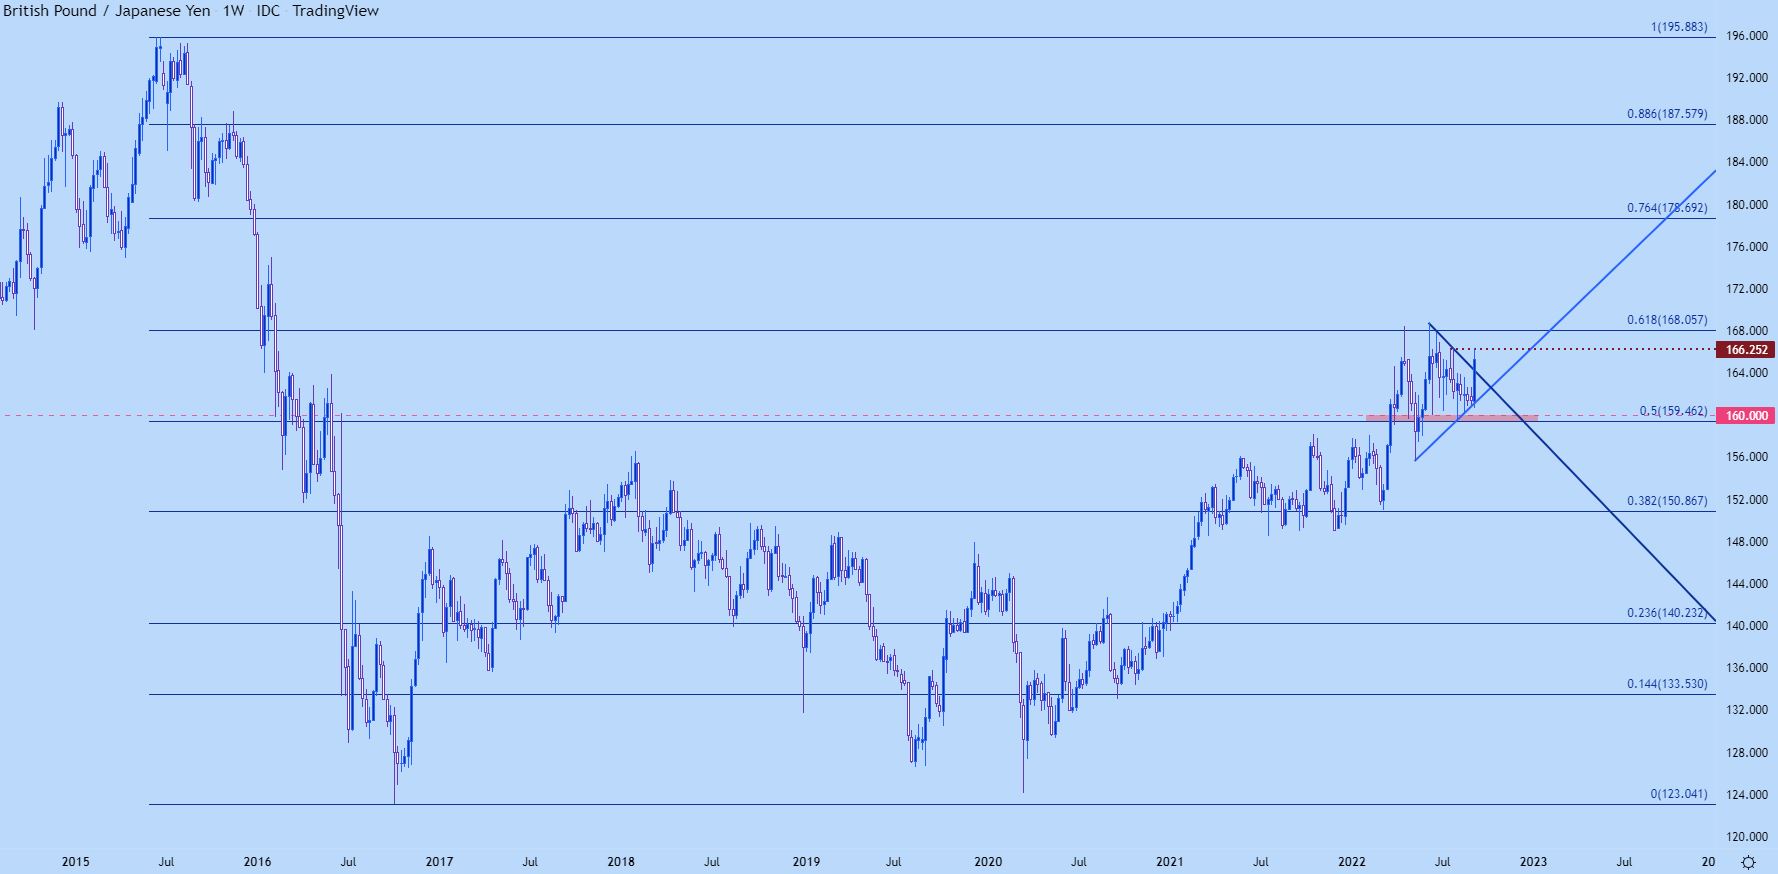
Chart prepared by James Stanley; GBPJPY on Tradingview
EUR/GBP
EUR/GBP pushed up for a test of a key resistance level this week. Given the interplay between the EU and the UK, this could remain an item of interest, particularly for Euro bears. First, the monthly chart, as there’s a Fibonacci retracement there that’s helped to define the recent range in the pair. This shows resistance at .8709 to go along with support around .8371.
EUR/GBP Monthly Chart
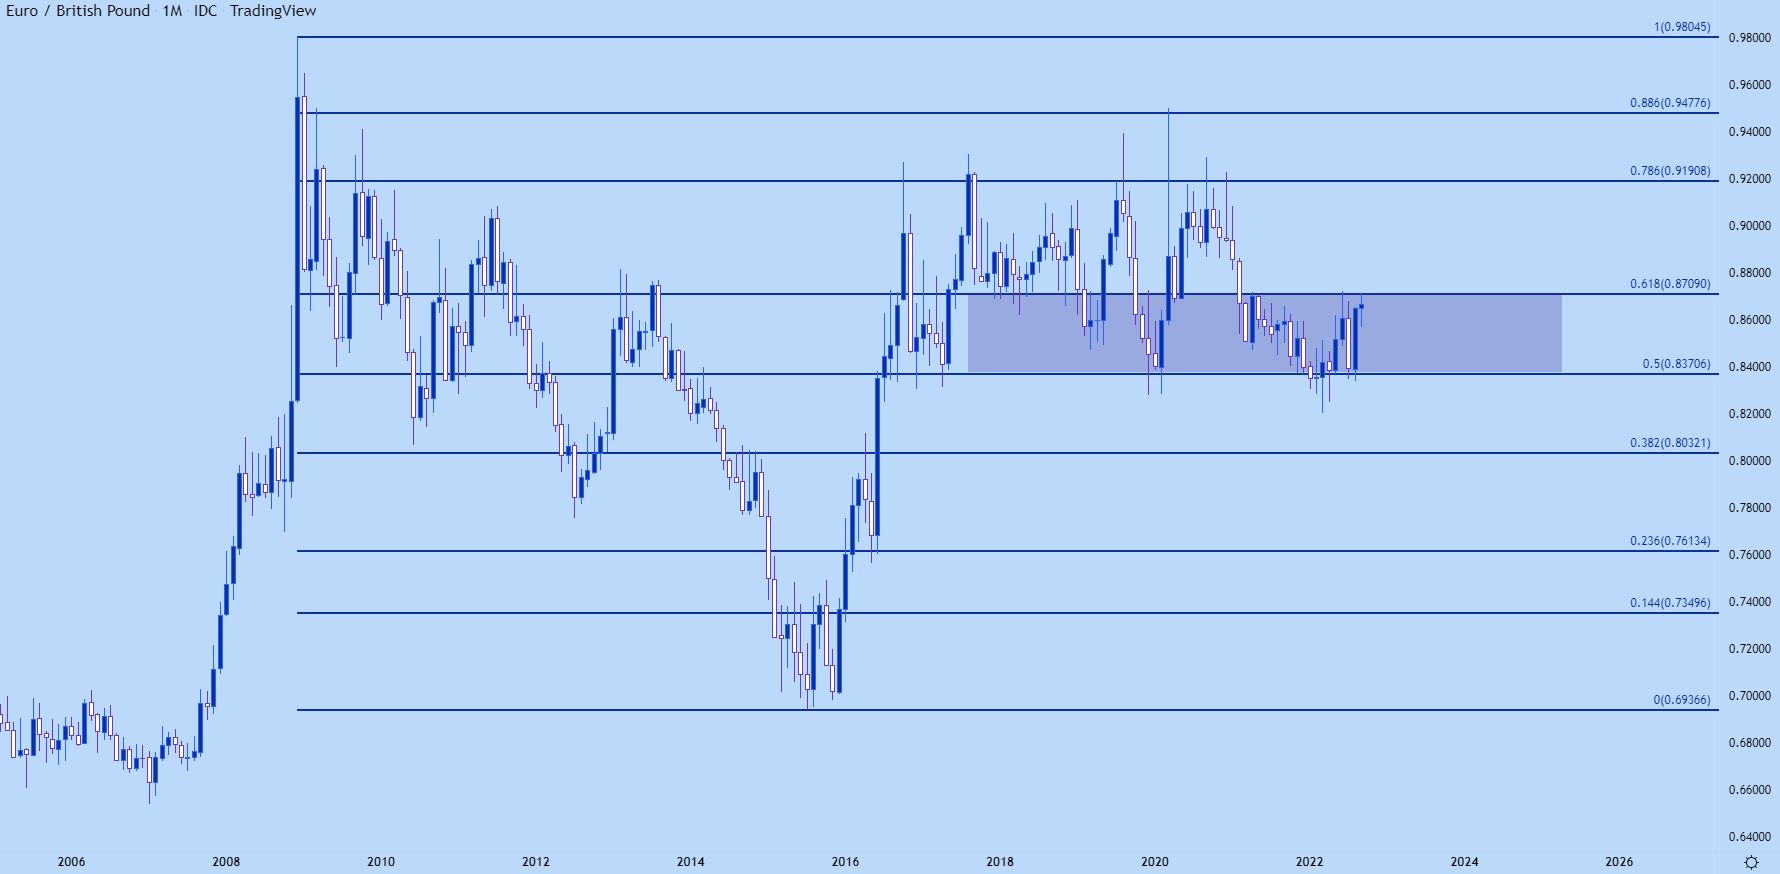
Chart prepared by James Stanley; EURGBP on Tradingview
From the weekly chart below, we can focus in on the rather outsized move that’s shown from the July lows, with the 50% marker was helping to set support which allowed for a move up to the 61.8% retracement. For a pair that has a proclivity to range, that’s a very consistent trend.
EUR/GBP Weekly Chart

Chart prepared by James Stanley; EURGBP on Tradingview
The daily chart is where matters get a bit more interesting in EUR/GBP as we’ve so far held a lower-high below the June swing. And as long as this remains the case, the door remains open for pullback themes, looking for range continuation. Once the high is traded through, however, we’re dealing with a fresh bullish breakout. I’m tracking the top of that resistance zone around the .8731 level which was the swing high in February of 2021.
EUR/GBP Daily Chart

Chart prepared by James Stanley; EURGBP on Tradingview
--- Written by James Stanley, Senior Strategist, DailyFX.com & Head of DailyFX Education
Contact and follow James on Twitter: @JStanleyFX


