


CRUDE OIL TECHNICAL PRICE FORECAST:
- Technical Outlook: Neutral.
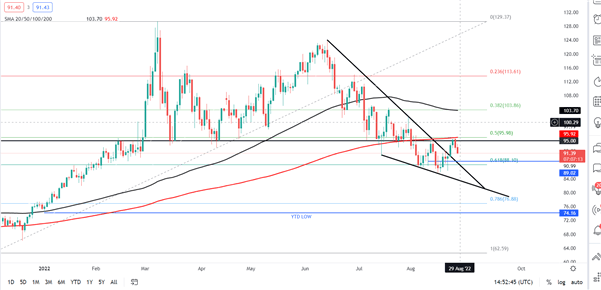
- WTI Crude Oil Prices Gained as Much as 10% Before Finding Resistance at 95.00 Key Level.
- Prices Retest the 200-SMA and Rejected for the Second Time in August.
WTI CRUDE OIL TECHNICAL OUTLOOK
WTI crude oil looks set to post a week of gains which comes on the back of a slightly bearishweek, highlighting the current sideways movement of the commodity on larger timeframes.WTI crude oil has once again bounced off the 61.8% fib level this week before bouncing and testing the 200-SMA on the daily chart after falling beneath it to start the month. We have now seen our second test of the SMA and rejected it once more as it rests on the key psychological level around 95.00 as well as the 50% fib level.
We have spent the majority of August trading between the 50-61.8% fib levels. We saw a break earlier this week of a falling wedge pattern yet failed to sustain momentum to break above the 200-SMA, 50% fib level, and the key psychological 95.00 level. The daily chart has also shown signs of bullish price action as we have broken bearish structure by creating a new high. We have retreated since then with Thursday’s daily candle closing as a bearish engulfing pattern indicating the possibility that prices fall further in the coming days. Should we get a sustained decline to begin the week we could see price find support around the 89-91.00 price level which would also see us create an inverse head and shoulders pattern with the early month low and mid-month low acting as the left shoulder and head respectively. This of course could take a few days to play out but is worth keeping an eye on.
Given the mixed signals from a technical perspective coupled with ever changing sentiment, the week ahead promises to be one of interest. In order to confirm a bullish move higher, we would need to see a sustained break above the 200-SMA with a retest and bounce confirming bullish momentum and potential further upside. A daily candle close below 89.00 could very well see us take out the 16th August low at 85.54.
Trading Strategies and Risk Management
Volatility
Recommended by Zain Vawda
WTI Crude Oil D Chart
Source: TradingView, prepared by Zain Vawda
Introduction to Technical Analysis
Learn Technical Analysis
Recommended by Zain Vawda
--- Written by Zain Vawda for DailyFX.com
Contact and follow Zain on Twitter: @zvawda


