


Gold and Silver Technical Forecast: Bearish
- Gold prices broke a five-week losing streak after making a fresh 2022 low
- XAU’s modest rebound, however, casts doubt over further price gains
- Silver prices moderate above 18, but the preceding downtrend may resume

Gold Technical Outlook
Gold snapped a five-week losing streak after prices fell to a fresh 2022 low and found support near the 2021 swing low around 1,680. From there, strength quickly faded. A recently breached support zone around 1,720, stretching back to April 2021, turned to resistance. That extinguished bullish sentiment and prices subsequently trimmed gains into the weekend.
On Friday, XAU was around 0.4% higher on the week, a rather uninspiring performance following a series of steep weekly losses. Gold prices look poised to surrender those gains and perhaps resume the preceding downtrend. If so, a drop to last week’s low of 1,681--a level that underpinned prices many times in 2021—is on the cards. A break lower would open the door to levels not traded at since early 2020.
Even so, gold bulls may regroup and attempt to recapture the zone of support around 1,720. The closely-aligned 23.6% Fibonacci retracement level offers a clear objective to retake. The MACD line is on course to cross above the oscillator’s signal line, a potentially bullish maneuver. The falling 26-day Exponential Moving Average (EMA) and the 38.2% Fib level would be likely targets should prices prevail.
XAU/USD Daily Chart
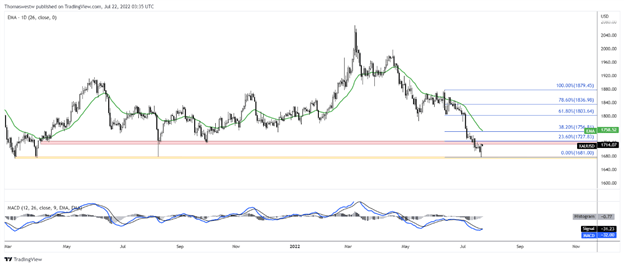
Chart created with TradingView
| Change in | Longs | Shorts | OI |
| Daily | 3% | -5% | -1% |
| Weekly | 12% | 3% | 7% |
Silver Technical Outlook
Silver prices broke a seven-week losing streak, although just barely, with prices tracking just 0.25% higher through Friday. An area of former resistance reaching back to October 2016 provided a base of support to XAG. Still, the bias remains skewed lower, with a multi-month downtrend in place. Since July 01, prices have dropped more than 7%.
Even so, silver may rebound if prices maintain last week’s low of 18.148. The MACD made a bullish crossover as the Relative Strength Index (RSI) rose out of its oversold territory. Like with gold, the falling 26-day EMA provides an obstacle that, if overtaken, may put prices back on a solid footing. From there, the 26-day EMA and 38.2% Fib retracement would come into focus.
XAG/USD Daily Chart
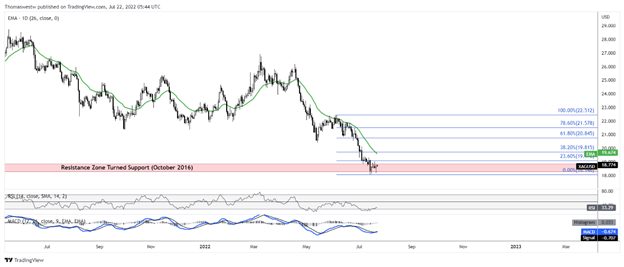
Chart created with TradingView
| Change in | Longs | Shorts | OI |
| Daily | -2% | -4% | -3% |
| Weekly | 5% | 7% | 5% |
--- Written by Thomas Westwater, Analyst for DailyFX.com
To contact Thomas, use the comments section below or @FxWestwater on Twitter


