


Technical forecasts for oil are always challenging as the market is so heavily driven by fundamental factors like demand and supply, geopolitical uncertainty, war, the value of the dollar, the state of the global economy and others.
Furthermore, global growth concerns rear their ugly head at a time when inflation remains uncomfortably high, leaving oil prices susceptible to an economic slowdown if the perfect monetary policy mix fails to materialize. My technical view favors a bullish continuation but at more conservative levels, with the chance of ranging between $105 and $114.83 into the end of the summer.
Crude oil remains elevated but dropped significantly in the last weeks of Q2 after the failed attempt to reach the March high was capped at $123.68 in June. Since then, price action eased as oil prices dropped. The (dotted) ascending trendline, acting as support throughout the majority of Q2 broke to the downside in the penultimate week of Q3 around a significant zone of resistance that warrants closer attention.
A zoomed out daily chart has been utilized below to focus on the more nuanced areas of interest that would not be captured on a weekly chart, given oil’s volatile rise over a short period of time.
The daily chart below depicts the zone of support as the red rectangle and comprises the $103.65 level of support; and the ($104.70) overlap of the 38.2% and 61.8% Fibonacci levels for the major 2020 move and recent April-June 2022 move, respectively. Thus, a break below this level with continued momentum is not to be taken lightly as it could set the tone for subsequent price action in Q3 with further downside support at the 78.6% retracement of the April-June move at $99.50 before the potential of a full retracement of the move at $92.93.
WTI Crude Oil (Daily Chart)
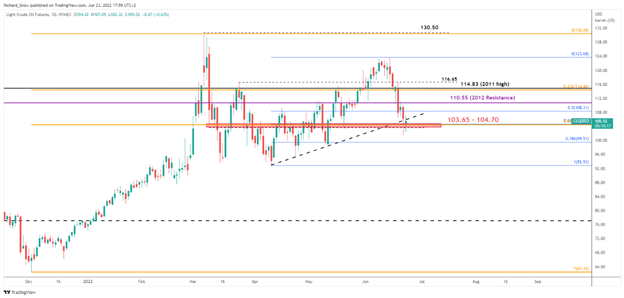
Source TradingView, chart prepared byRichard Snow
WTI Crude Oil Technical Forecast for Q3: Bullish
However, at the time of writing (23 June), the breakdown is inconclusive and could very easily result in a false breakout, or ‘false breakdown’ in this case. The June 22nd daily candle broke below the trendline but immediately rose to close back above it – signaling that the longer-term uptrend may still have some life left. Therefore, should we see continued rejection of lower prices (extended lower wicks), the oil market would appear primed for a return to the bullish trend should a positive catalyst appear.
The upside target coincides with the 2011 high of $114.83 which overlaps with the 23.6% Fib of the March 2020 move. Such a conservative target is consistent with my view that although oil prices remain bullish, there are a number of challenges to significantly higher oil prices, with the biggest inhibitor being demand destruction and lower household purchasing power. In fact oil prices could range between current levels ($105) and $114.83 as driving season continues through the remainder of the US summer.
The weekly chart sends out a rather stark warning for oil bulls not to be complacent and to manage risk appropriately as a bearish crossover appears on the MACD indicator. The MACD came ever so close to a bearish crossover in April, narrowly avoiding it as prices rose once more.
WTI Crude Oil (Monthly Chart)
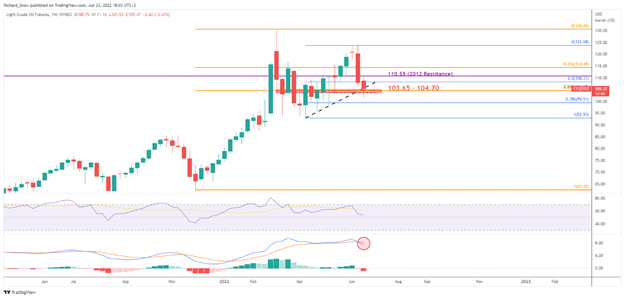
Source: TradingView, prepared by Richard Snow
It will be crucial to monitor price action early on in Q3 in the event this bearish crossover shows signs of follow through. A move towards $95 wouldn’t bode well for the bullish outlook and a move below $92.93 would invalidate it.


