


At one point last quarter the U.S. stock market was off by about 25%, with all losses coming in the first half of the year. Stocks became oversold with sentiment nose-diving, and on that it appears we are in for a bit of a recovery. However, all that is expected is just that – a recovery rally amidst a broad bear market.
S&P 500
The rally could be sharp and bring back a fair amount of optimism before all is said and done. It will be key for S&P 500 futures to hold onto the recent lows at 3639, and if broken it will need to be a short-lived event, if the recovery outlook is to maintain.
On the top-side, a rally could develop towards 4200, but not likely to exceed it by much given the bigger picture bear market outlook. Countertrend moves can be tricky when trying to play momentum, so taking a pullback approach (buy-the-dip) may be the most prudent way to participate.
S&P 500 Weekly Chart
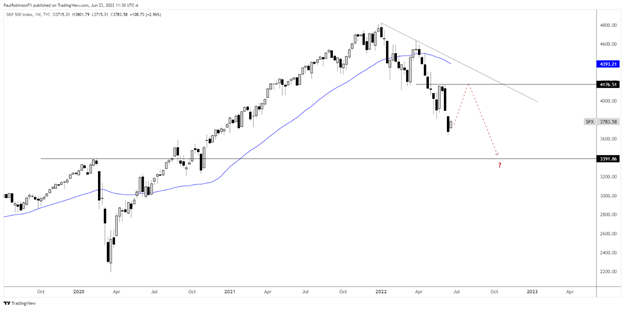
Chart created with TradingView
DAX 40
At one point last quarter the German benchmark was holding up much better than its US counterpart, but that outlook quickly changed towards the end of the last leg lower. The DAX is likely to recover, but it could be a bit more sluggish than the US index.
Watch support via the trend-line off the March 2020 low. A firm breakdown below 12965 could have the earlier-year low in play. On the top-side, watch the trend-line off the January peak, and after that resistance clocks in from just over 14700 up to 14925.
DAX 40 Weekly Chart
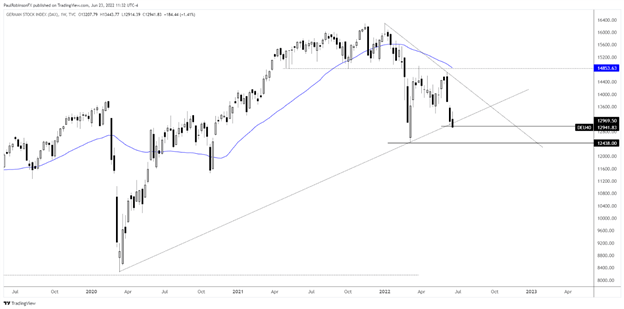
Chart created with TradingView
Nikkei 225
The Nikkei is also looking like it could be on path to a sluggish move higher despite having generally been stronger than the US market. A bounce could have the 200-day at 27754 (& declining) and trend-line off the 2021 high in play as strong, confluent resistance. This could be a spot to look for the Nikkei to roll over. On the downside the March 2020 trend-line is in the area as support, followed by the yearly low at 24681.
Nikkei 225 Weekly Chart
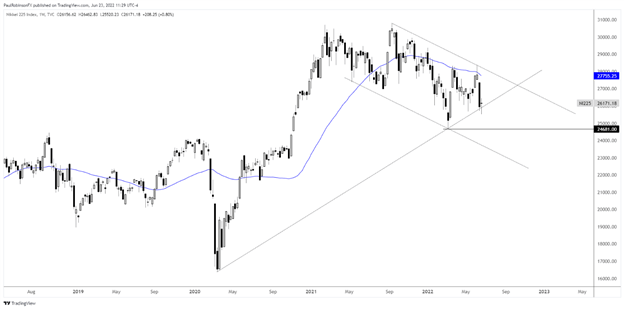
Chart created with TradingView


