


Japanese Yen Technical Forecast: Neutral
- The Japanese Yen’s decline against the US Dollar moderated last week
- Prices fell back below the 2002 high after a Bearish Engulfing Candle
- Momentum oscillators are flashing mixed signals for the week ahead

The Japanese Yen’s free fall versus the US Dollar largely slowed last week, with USD/JPY nearly unchanged moving into the weekend. The currency pair made a fresh yearly high before trimming strength, breaking above its 2002 high and rising to levels not traded at since 1998. The staggering weakness in the Yen has captured attention across global financial markets, but signs are showing that JPY bears may rest in the week ahead.
USD/JPY fell below the 2002 high after a Bearish Engulfing candlestick formed on the 8-hour chart. Prices subsequently fell to the 23.6% Fibonacci retracement level from the May-June move. On Friday, the Yen began weakening once more, and prices rose to test the recently broken 2002 high, which appeared to dissuade prices from climbing further.
A clean break above the 2002 high may see bulls make another move higher, possibly overtaking last week’s yearly high and pushing further into 1998 levels. The Relative Strength Index (RSI) suggests that momentum is recovering, with a bounce off its 50 mid-point level. However, the MACD oscillator is on the move lower after crossing below its signal line. A break below the 23.7% Fib may see prices fall to the rising 20-day Simple Moving Average (SMA).
USD/JPY 8-Hour Chart
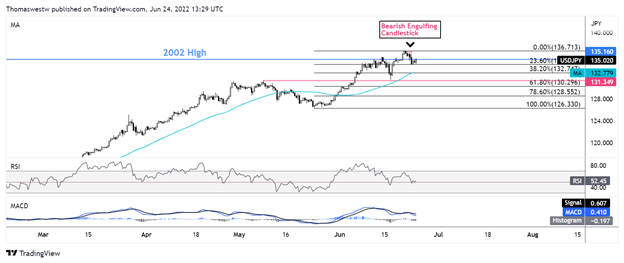
Chart created with TradingView
Trade Smarter - Sign up for the DailyFX Newsletter
Receive timely and compelling market commentary from the DailyFX team
--- Written by Thomas Westwater, Analyst for DailyFX.com
To contact Thomas, use the comments section below or @FxWestwater on Twitter


