


Indices Technical Forecast: Bullish
- The market is set up to continue its recovery phase
- Bullish bottom sequence set up to trigger soon
S&P 500 Technical Forecast
The S&P 500 is in the process of a triggering an ‘RST’ pattern, a bullish sequence (or bearish if ending a trend) where growing instability carves out a series of higher highs and lower lows and creates the ‘Reverse Symmetrical Triangle’ pattern.
With a weekly close above 3807.50 in the ES contract, we have a confirmed trigger. This strengthens an upward bias and will remain intact as long as the low at 3639 isn’t broken. Looking at the top-side there is a slope running lower that will be targeted first, currently over the 4k mark.
On the downside, should we see a pullback to 3807.50 it could over a solid buy-the-dip opportunity for would-be longs.
S&P 500 Daily Chart

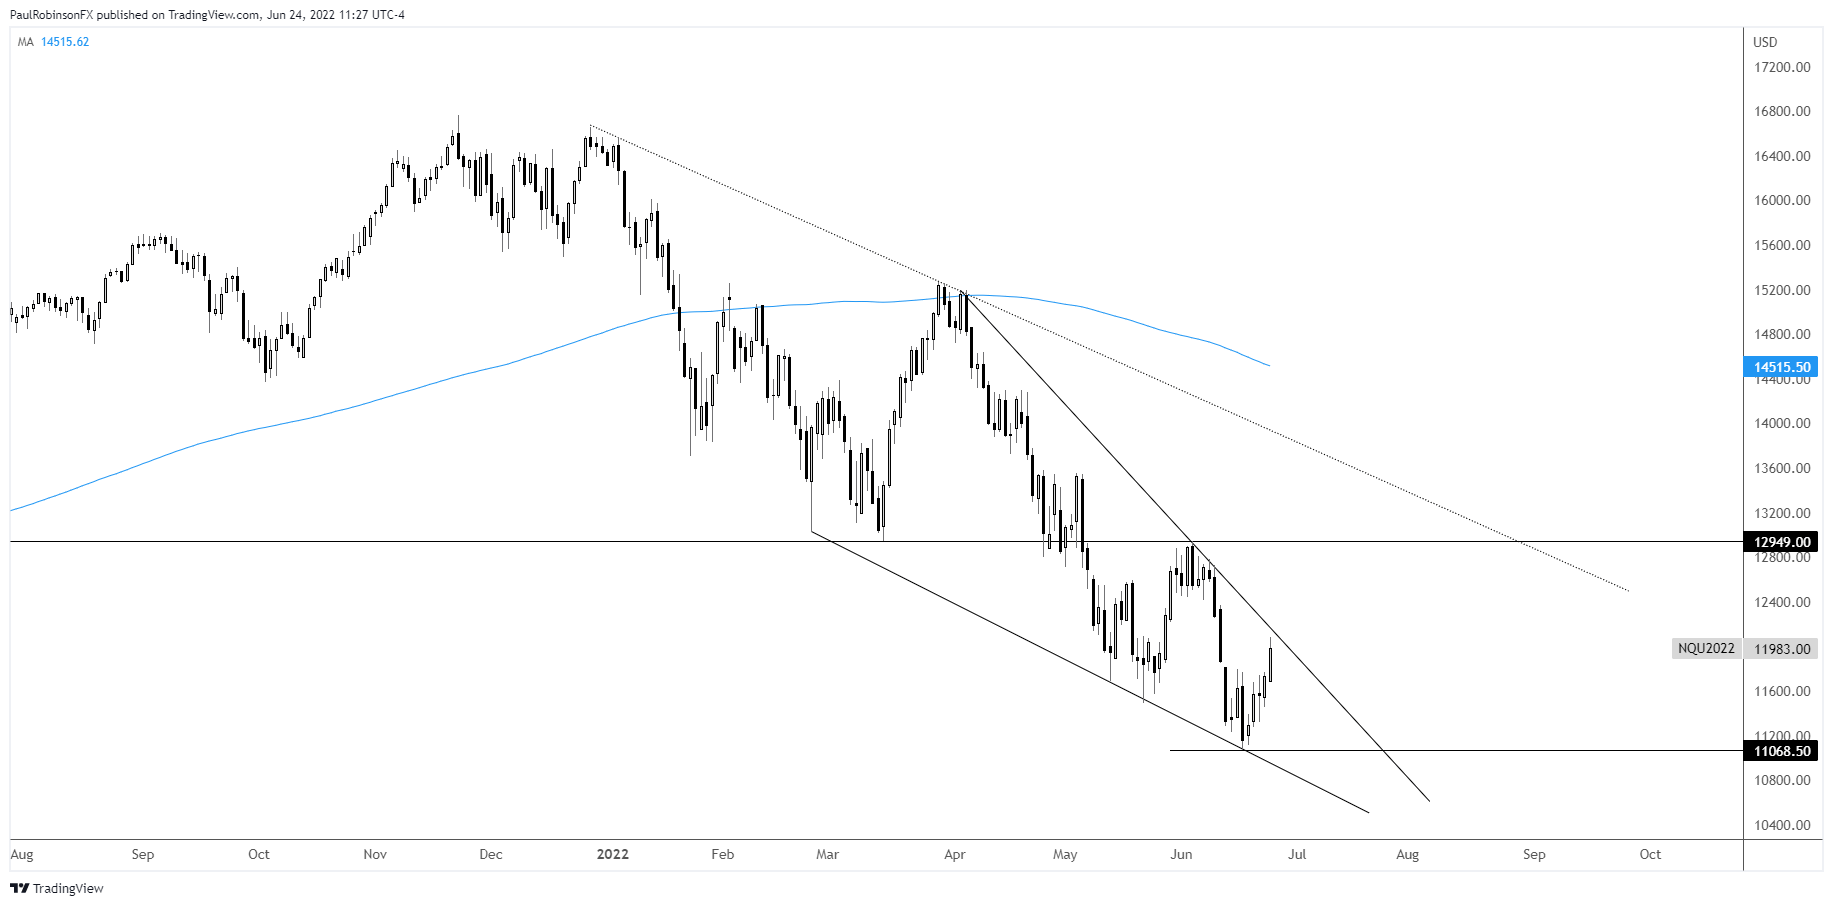
Nasdaq 100 Technical Forecast
TheNasdaq 100 has the same sequence, with the low at 11068.50 as the stop on the pattern. There is also a developing falling wedge that could lead to a sharp squeeze. A trigger of this pattern occurs by crossing the top-side trend-line and could lead the NQ higher to around 12950 and towards the trend-line off the record high.
Nasdaq 100 Daily Chart
Nasdaq 100 Chart by TradingView
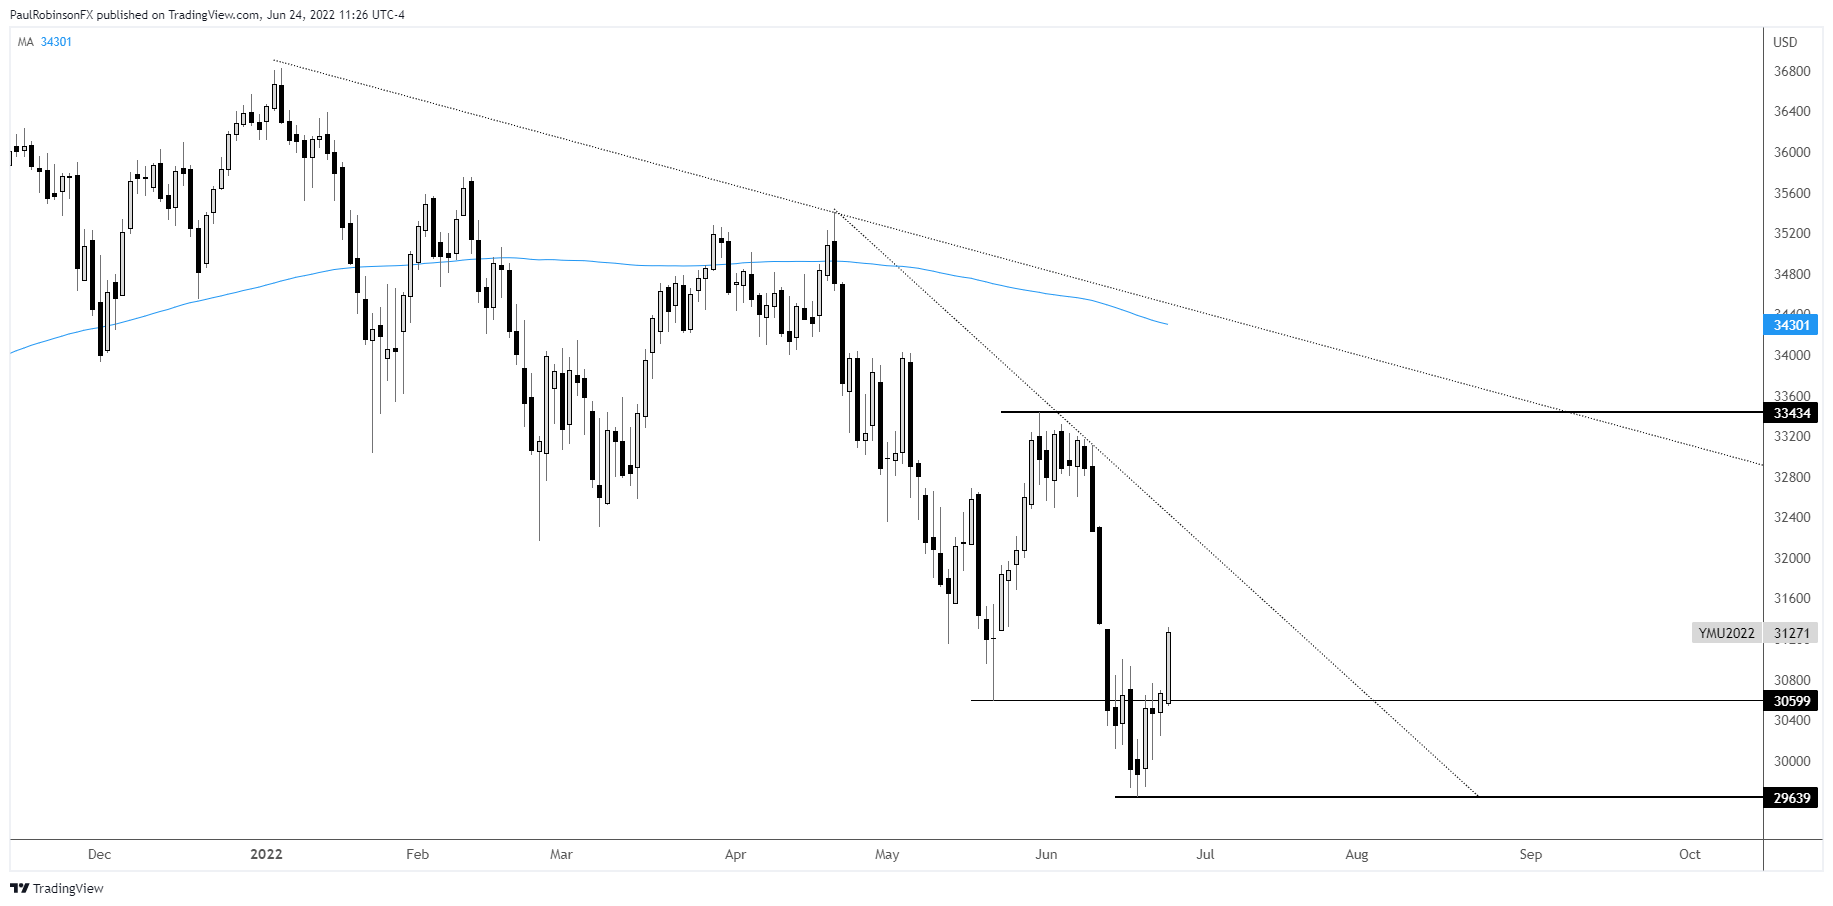
Dow Jones Technical Forecast
The Dow Jones is also powering ahead out of the same formation as the other two indices. Looking at the downside, the recent low at 29630 needs to hold for the current outlook to maintain. On the top-side a trend-line from April will become the first target. A pullback to 30599 may offer up an opportunity for would-be longs to enter.
Dow Jones Daily Chart
Dow Jones Chart by TradingView
Resources for Forex Traders
Whether you are a new or experienced trader, we have several resources available to help you; indicator for tracking trader sentiment, quarterly trading forecasts, analytical and educational webinars held daily, trading guides to help you improve trading performance, and one specifically for those who are new to forex.
---Written by Paul Robinson, Market Analyst
You can follow Paul on Twitter at @PaulRobinsonFX


