Indices Technical Forecast: Neutral to Bullish
- The market is in bounce mode and should continue higher in the interim
- But any strength from here is viewed as transient as the broader outlook remains bearish


S&P 500 Technical Forecast
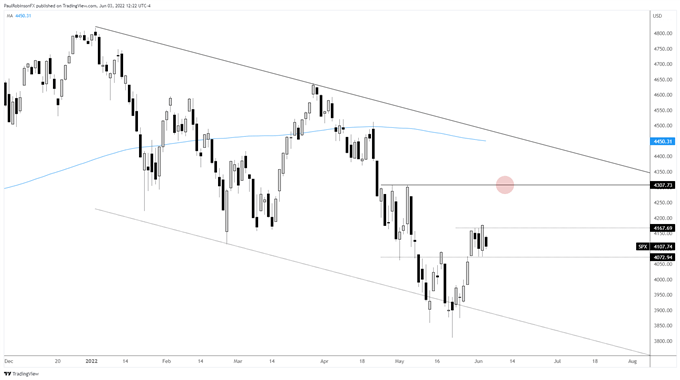
The S&P 500 is in rally mode of the most part even if we finished on a sour note last week. This appears to be set up to be the case for a bit longer even though it appears, generally speaking, we are in bear market mode. Markets don’t go straight down, so rallies are to be expected.
With that in mind, further strength up to around 4300 could be in the cards in the relatively near future, with the 200-day at 4450 (& declining) and top-side parallel from the record highs seen as the maximum we will see before another major leg down develops. Short-term support checks in at 4074.
For now, it could be a bumpy ride higher, but overall it does appear some time will be spent moving higher before lower again.
S&P 500 Daily Chart

Nasdaq 100 Technical Forecast
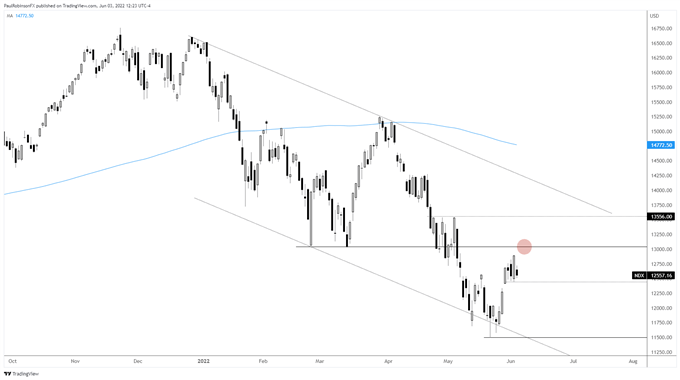
TheNasdaq 100 has some sizable resistance to overcome around 13020/65 if it is to continue its recovery. Beyond there will be looking to 13556 and then the channel line off the highs. Watch 12447 as support in the near-term.
Nasdaq 100 Daily Chart

Nasdaq 100 Chart by TradingView
Dow Jones Technical Forecast
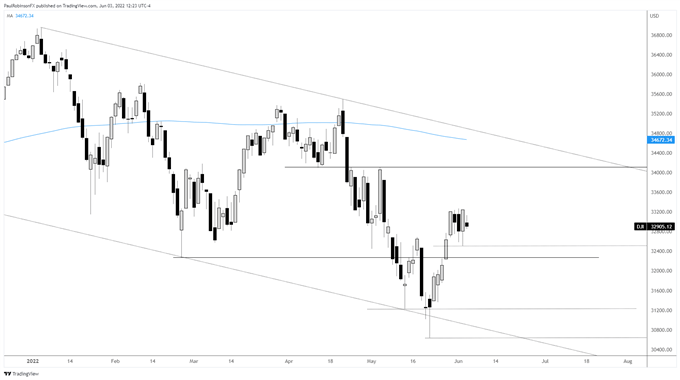
The Dow Jones is consolidating. Generally speaking it is stronger than the S&P and Nasdaq 100, so it should continue to lead on the top-side during the recovery phase. The area around 34100 could come into play as meaningful resistance. Short-term support clocks in at 32509.
Dow Jones Daily Chart

Dow Jones Chart by TradingView
Resources for Forex Traders
Whether you are a new or experienced trader, we have several resources available to help you; indicator for tracking trader sentiment, quarterly trading forecasts, analytical and educational webinars held daily, trading guides to help you improve trading performance, and one specifically for those who are new to forex.
---Written by Paul Robinson, Market Analyst
You can follow Paul on Twitter at @PaulRobinsonFX


