


US Dollar Technical Forecast Talking Points:
- After a robust year’s rally, the Dollar has started to flag just over the past few weeks – is this a natural correction or true reversal?
- There is heavy technical reference in the reversal from EURUSD starting at 1.08, but a pair like USDJPY has moved so far and fast that there is little reference along the way
- The Dollar’s performance has a range of contrasting performance, but USDCNH is perhaps the most bullish case for the Greenback

Technical Forecast for US Dollar: Bearish
No market can head in a single direction forever. For the US Dollar measured via the DXY trade-weighted index, a 17 percent advance through a rolling 12-month period was the strongest overall bullish climb since March 2015. More than just the tempo, the rally to 105 represented a drive to the highest overall level for the benchmark index since late 2002. For general level, there was little technical reason for the market to stall out as we had already cleared previous March 2020 (approximately 103) and January 2017 (103.80) highest. As such, the market had technically surpassed resistance, but follow through would still require some degree of conviction. Referencing the next major level, the 38.2 percent Fibonacci retracement formed from the March 1985 record peak to March 2008 record low stands at approximately 106.60.
However, in the retreat we’ve seen over these past two weeks, the bulls have clearly lost the initiative; and progress has been lost with a more-than 2 percent reversal in two weeks. Support levels are less proximate after such a long run, but the 50-day SMA is a first general floor with the 100 mark a psychological level should the retreat extend.
Chart of DXY Dollar Index with 50-Day SMA and 20-Day ATR (Daily)
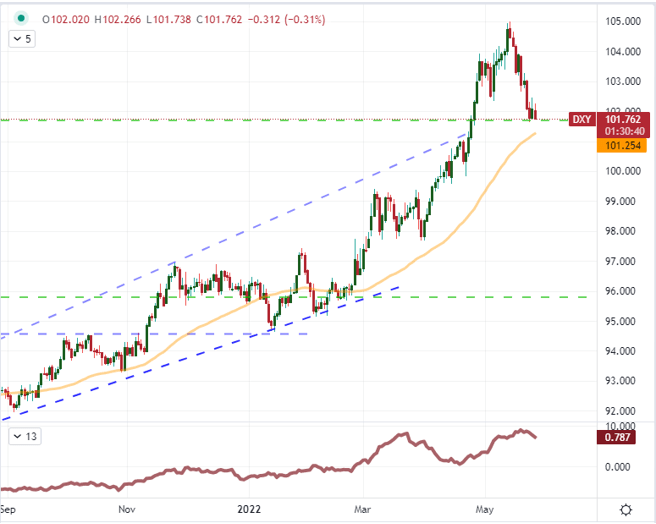
Chart Created on Tradingview Platform
While the Dollar and its major crosses are starting to show some sign of exhaustion and correction, there remains a remarkable level of volatility. DXY’s 20-day ATR is hovering near its highest level since the pandemic, as is EURUSD around 93 pips. The higher the resting rate of realized volatility, the more capable the market is at clearing further technical hurdles. Drive is necessary for the FX market’s most liquid pair given the density of resistance around 1.0800. The confluence of a 50-day simple moving average with the mid-point of the past two months range as well as the 38.2 percent Fibonacci resistance in the move lower since February represents an overwhelming technical reference. The more overt a technical boundary is, the more likely it is to stand against moderate efforts to override. The larger trend for EURUSD is bearish (Dollar bullish), but clearing 108 could open up a much larger correction.
| Change in | Longs | Shorts | OI |
| Daily | -2% | 1% | -1% |
| Weekly | -15% | 16% | -6% |
Chart of EURUSD with 50-Day SMA (Daily)

Chart Created on Tradingview Platform
Another Dollar pair where a reversal looks more ‘overdue’ than ‘impossible’ is USDJPY. The -3.5 percent pullback from the 20 year high 131.35 barely scratches the surface of a reversal. That is a familiar state among most of the Yen crosses, but the USD’s own contribution to the mix certainly shows through on this very liquid pair. For support, the same 50-day simple moving average can be found as first level support. The June 2015 swing high of 125.85 could be seen as a subsequent level of reference, but the 124.85 Fibonacci of the three-month leg from February to May likely carries perhaps more recognition among technical observers. Further, with the CFTC’s net speculative futures positioning measure standing at relative net long extremes (above 100,000 contracts in favor of bulls), it is more sentiment than barriers that represents pressure here.
Chart of USDJPY with 50-Day SMA (Daily)
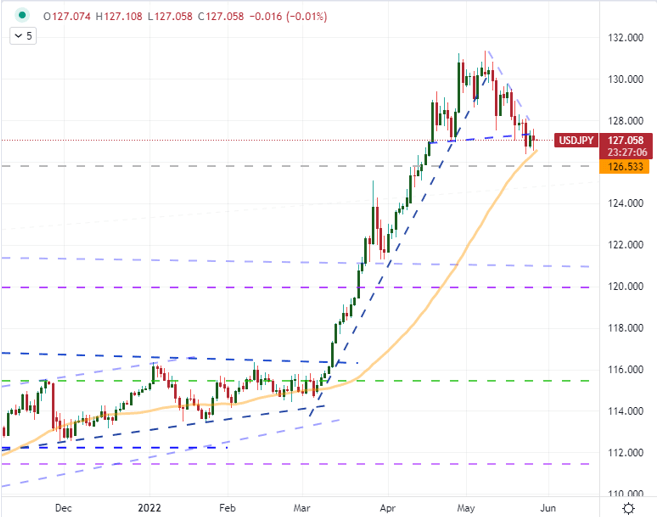
Chart Created on Tradingview Platform
For most of the major Dollar crosses, the picture is the same: an exceptionally strong Greenback that is only in the early phases of retracing its gains. There are some exceptions such as USDCAD where the initial rally was not as overwhelming and therefore the retreat to the midpoint of the past two months’ range is less surprising. An even more remarkable outlier, however, is USDCNH – the Dollar to Chinese Yuan exchange rate. This cross has only indulged Dollar strength for approximately a month following the ‘neckline’ break on a drawn out inverse head and shoulders pattern. After a nearly 8 percent rally from that 6.4000 break, we have retraced nearly to the 61.8 percent Fibonacci reversal of the offshore Yuan’s record low set on June 2020 to the March 2022 peak. Just through the end of this past week, USDCNH regained serious traction to once again put the dominant bull trend back in power. Whether we clear 6.8500 or 6.6500 (38.2 percent of the same range), could lead us to the next leg forward.
Chart of USDCNH with 50-Day SMA (Daily)

Chart Created on Tradingview Platform


