


Crude Oil Price Analysis:
- Oil prices take strain, China lockdowns overshadow supply shortages
- US Crude (WTI) attempts to reach the $110.00 psychological handle but key technical levels hold bulls at bay
- Price action stalls, remains supported the by the critical $100 mark

Oil Prices Lose Grip at a Huge Technical Level
Oil prices have continued to experience whipsaw price action as the battle between supply shortages and lockdowns in China persists.
Although prices remain on an uptrend, technical suggest that the bulls still have a few hurdles to clear for bullish continuation to be probable.
Crude Oil (WTI) Technical Analysis
The monthly chart below illustrates how Fibonacci levels from both the historical (2008 high – 2020 low) and the 2014 – 2016 move have provided firm levels of support and resistance for price action.
In the midst of the 2008 Financial crisis, oil prices rose to an all-time high of $147.27 (July 2008) which is yet to be violated. On the downside, the impact of the Covid-19 pandemic and global lockdowns pushed oil futures into negative territory for the first time in history (April 2020), reaching a historical low of -$40 .32.

Crude Oil (WTI) Monthly Chart
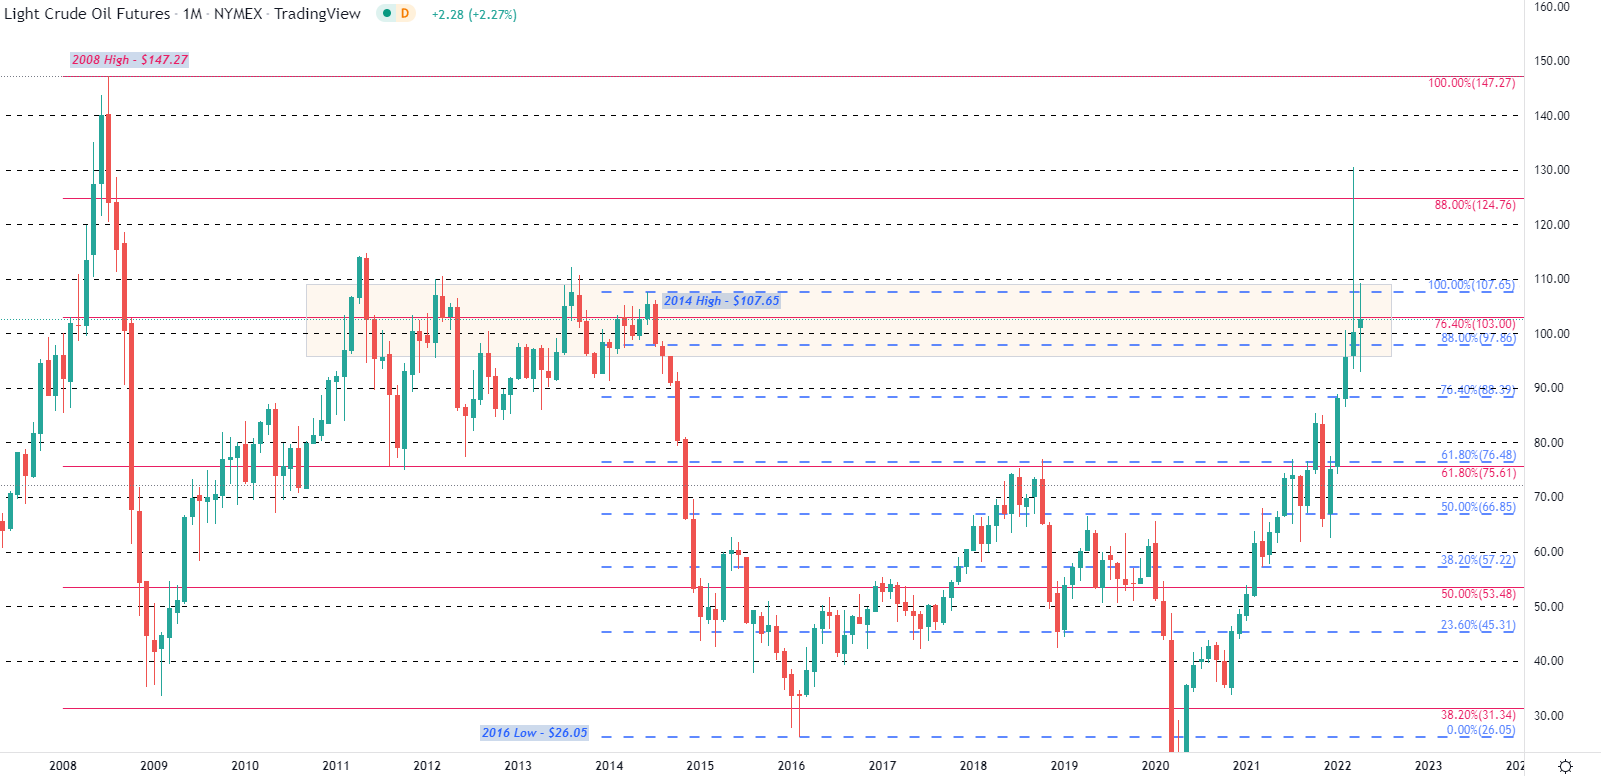
Chart prepared by Tammy Da Costa using TradingView
Crude oil gets stuck within the confines of a well-defined range
However, with OPEC (Organization of Petroleum Exporting Countries ) reducing oil production to combat the effects of the fall in demand, the reopening of global economies resulted in supply constraints which have now been exacerbated by the unresolved conflict between Russia and Ukraine.
However, while OPEC has agreed to increase production to 432,000 barrels per day (from the current 400,000 barrels), the lockdown in China (the world’s second largest economy) has raised concerns over decreased demand, capping the upside move.

On the weekly chart, the $93.50 – $107.65 levels have provided a zone of confluency, with buyers and sellers looking to drive price action out of this range.
Although a sharp rally from the November 2021 low saw oil surge approximately 110% until peaking in early March, momentum has lost steam as prices trade in the above-mentioned range.
Crude Oil (WTI) Weekly Chart
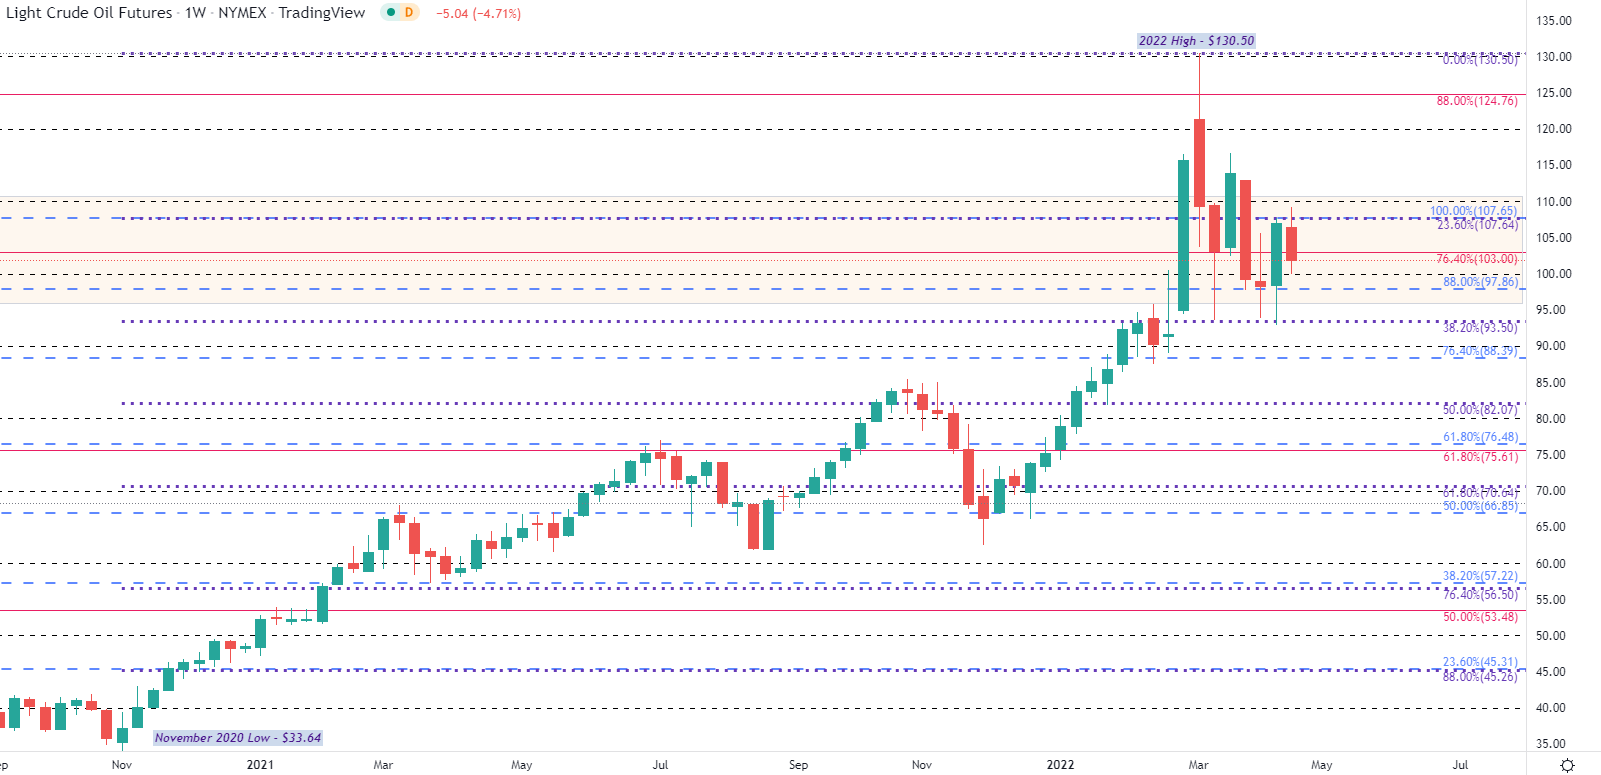
Chart prepared by Tammy Da Costa using TradingView
Introduction to Technical Analysis
Technical Analysis Tools
Recommended by Tammy Da Costa
Oil prices stabilize as price action lacks momentum
From a short-term perspective, the daily chart highlights how the 50-day MA (moving average) has assisted in limiting both gains and losses.
After rising above the major $100 handle, a break of the descending trendline (taken from the 2022 high), allowed bulls to drive prices higher before running into a huge zone of resistance at the $108.00 psychological level (just above $107.65, a key Fib level).
With price action currently trading along the 76.4% Fibonacci level of the long-term move ($103.00), a series of low bodied candlesticks suggests that there is still a lot of indecision in the market which may give way for a break in either direction. Meanwhile, the MACD (moving average convergence) has stabilized at the zero level, a potential reiteration of indecision.
Crude Oil (WTI) Daily Chart
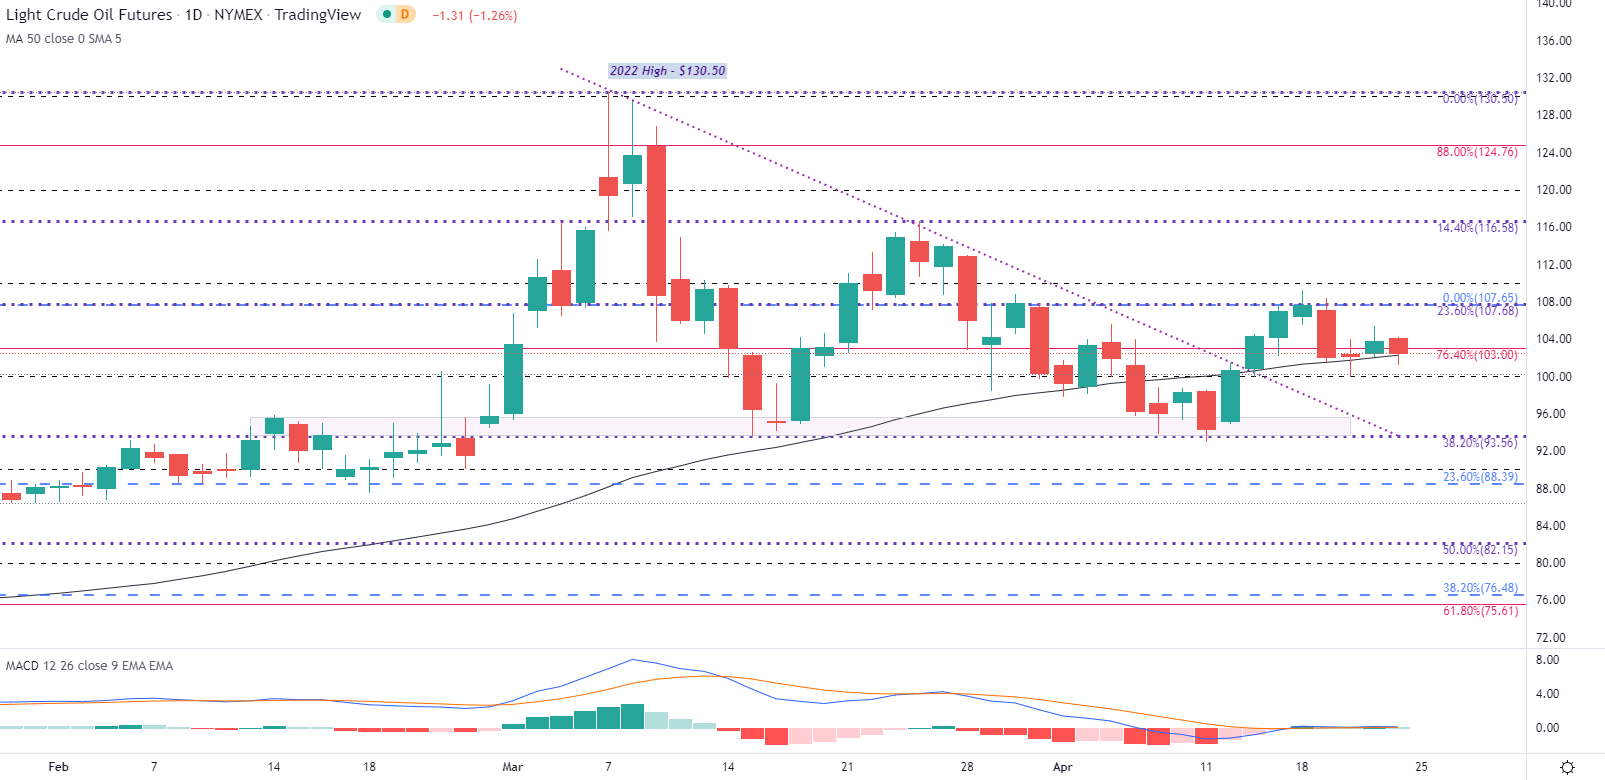
Chart prepared by Tammy Da Costa using TradingView
For bearish momentum to gain traction, sellers would need to drive prices below $100 which could then bring the next level of support into play at $93.56 (the 38.2% retracement of the Nov 2020 – 2022 move). A break below that level and below $90.00 and below $88.39 (23.6% Fib of the 2014-2016 move) would then open the door for the $80.00 mark.
On the bullish side of the spectrum, a break of the $107.65 and $108.00 could make way for a retest of the $116.58 Fib with a probability to reclaim $120.00
--- Written by Tammy Da Costa, Analyst for DailyFX.com
Contact and follow Tammy on Twitter: @Tams707


