


Indices Technical Forecast: Neutral
- S&P 500 trading around the 200-day, the near-term level to watch
- Nasdaq 100 trying to hold a swing-high from March
- Dow Jones has a trend-line/200-day to watch ahead
S&P 500 Technical Forecast
The S&P 500 is trading around the 200-day, making it a bit of a complicated short-term picture as price swings become erratic around the widely-watched moving average. Holding last week’s low will be the first thing to look for if the market is to stabilize and try and trade higher.
The double-bottom low on Wednesday/Thursday is at 4450. This will be the line-in-the-sand for longs, and if we dip below then look to a swing-high created in March at 4416 as the next threshold of support. Resistance clocks in at the trend-line off the Mar 29 high. From there 4492 and then the Mar 29 high itself at 4637.
S&P 500 Daily Chart

Nasdaq 100 Technical Forecast
TheNasdaq 100 is doing its best to maintain the mid-March swing high, with last week’s low arriving at 14315. It was tested a couple of times late in the week with the bounce off not really convincing. Watch to see how it plays out as the new week rolls around. On the top-side there is a glaring gap up to 14820 that may fill should support lead to a rally.
Nasdaq 100 Daily Chart
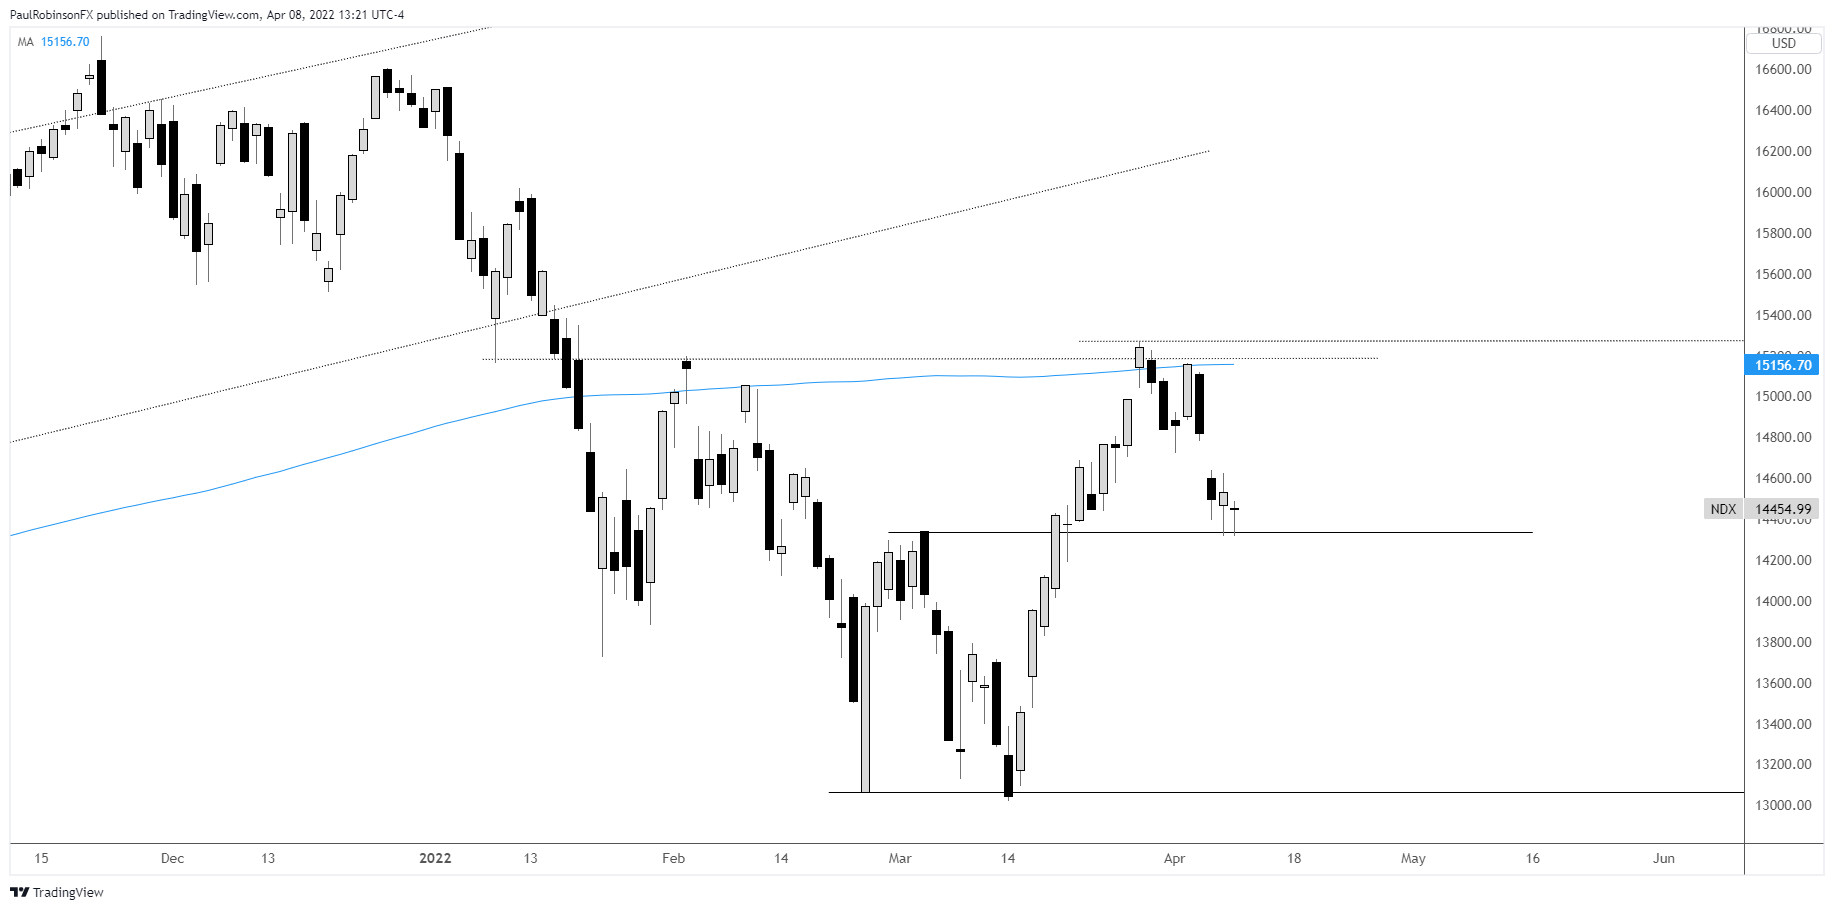
Nasdaq 100 Chart by TradingView
Dow Jones Technical Forecast
The Dow Jones is in better shape as far as last week’s low holding, with it clocking in down at 34190. Beneath there is the 34k mark, a pretty significant level should it get tested. On the top-side, the 200-day is at 35018, along with a trend-line of the record high, and a short-term swing high at 35112. Trading could be choppy given the levels in close proximity.
Dow Jones Daily Chart

Dow Jones Chart by TradingView
Resources for Forex Traders
Whether you are a new or experienced trader, we have several resources available to help you; indicator for tracking trader sentiment, quarterly trading forecasts, analytical and educational webinars held daily, trading guides to help you improve trading performance, and one specifically for those who are new to forex.
---Written by Paul Robinson, Market Analyst
You can follow Paul on Twitter at @PaulRobinsonFX


