


The Australian dollar has been one of the most resilient currencies against the dollar through Q1 2022, primarily via the broad commodity price rally and strong trade relations with China.
Global Currencies Vs. USD Year to Date
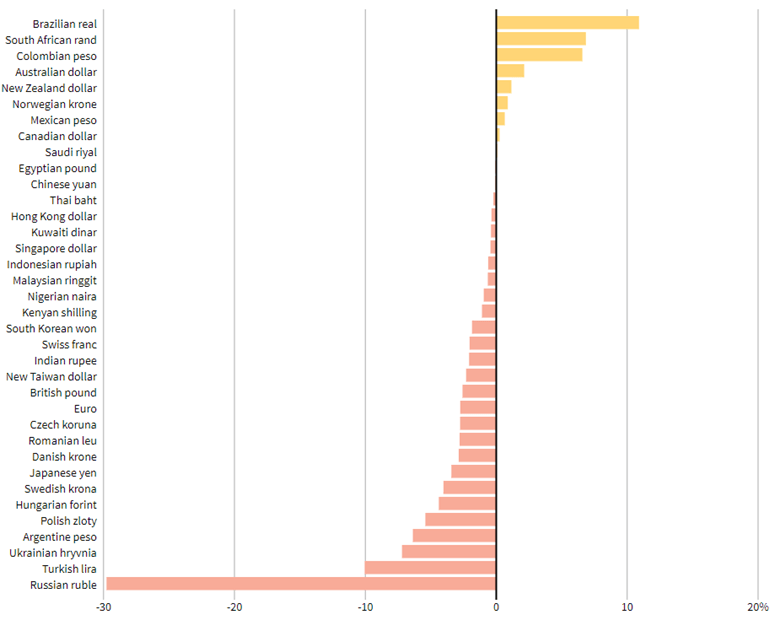
Source: Reuters
While the situation in Ukraine saw many global currencies deteriorate in favour of the safe-haven greenback, the AUD and currencies alike flourished giving the Reserve Bank of Australia (RBA) greater optionality in their approach. The graphic below underlines the strength of the Australian economy at the current juncture with unemployment at record lows while inflationary pressures are comparatively muted to many of its global counterparts including the US. The RBA has held the cash rate steady at 0.1% since late 2020 but the solid economic data in Australia would definitely allow for upcoming tightening action from the central bank. The RBA’s Governor Philip Lowe has voiced concerns around inflation, yet core CPI remains within the bank’s target band of 2-3%. Another key metric that could prompt a rate hike could be around wage increases but this figure has yet to breach the 3% mark.
Australian Cash Rate, Core Inflation and Unemployment Data

Source: Refinitiv
The divergence between the Federal Reserve and RBA up to this point gives the AUD an upper hand should the RBA turn hawkish.However, a relatively muted market reaction from an aggressive Fed could give USD bulls near-term support. Rising COVID-19 cases in China has induced strict lockdowns from the Chinese government and could weigh on AUD upside should the situation negatively impact Chinese growth, commodity prices and demand.
On the contrary, the conflict in Ukraine gives a boost to commodity prices. Australia’s resistance to the current geopolitical conditions should continue to buoy the currency if the war is prolonged through Q2. This positive relationship between commodity prices and AUD/USD is exemplified by the Australian Commodity Price Index shown below:
AUD/USD Vs Australian Commodity Price Index

Source: Refinitiv
AUD/USD Technical Analysis
AUD/USD Weekly Chart

Chart prepared by Warren Venketas, IG
The long-term weekly chart above may be suggestive of a turn higher should price action breakout from the developing bull flag chart pattern (blue). Typically, a bull flag represents a bullish continuation and could bring into consideration the 0.7500 psychological level and beyond. I will be looking for a clear weekly candle close above flag resistance before considering further upside.
AUD/USD Daily Chart
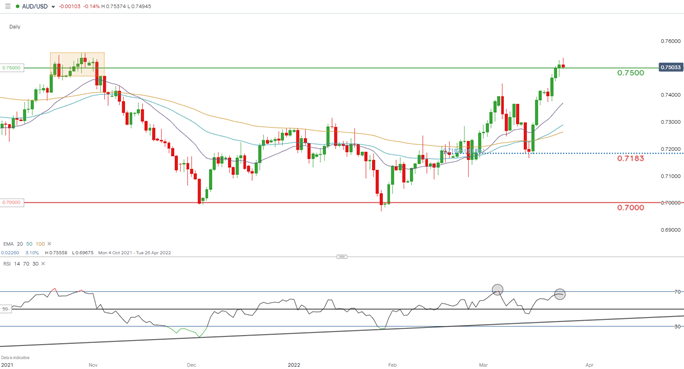
Chart prepared by Warren Venketas, IG
While the longer-term view may lead to subsequent highs, the daily chart portrays a few limiting indications particularly via the Relative Strength Index (RSI). There is the possibility of bearish divergence unfolding as the RSI trends lower (black) relative to AUD/USD price action. Bulls failed to decisively break above the 0.7500 resistance zone in October 2021 which could repeat itself short-term. I forecast a move lower before a secondary rally higher as the commodity currency takes advantage of its strong economy and surging commodity prices.
Key resistance levels:
- 0.7250
- 0.7183
Key support levels:
- 0.7100
- 0.7052
Trade Smarter - Sign up for the DailyFX Newsletter
Receive timely and compelling market commentary from the DailyFX team


