


US Dollar Technical Forecast
- US Dollar DXY index breaks 5-week winning streak, but upside may resume
- EUR/USD upside looks exhausted, and prices look primed to continue sliding

US Dollar DXY Index - Technical Forecast: Bullish
The DXY Index broke a 5-week winning streak last week, losing almost a full percentage point. Still, the Greenback remains around 1.5% higher for March. The rising 20-day Simple Moving Average underpinned prices after bears advanced through an ascending trendline earlier in the week. The 23.6% and 38.2% Fibonacci retracement levels appear to be providing intermediate support and resistance.
A break above the 23.6% Fib level would open the door for bulls to attack the prior 2022 high at 99.41. That could introduce a fresh breakout if prices manage to clear that level. The 100 psychological level – not traded at since May 18, 2020 -- would offer the next major obstacle. The MACD line looks to be on track to cross above its signal line, a bullish sign that may introduce some upside in prices.
US Dollar (DXY) 4-Hour Chart
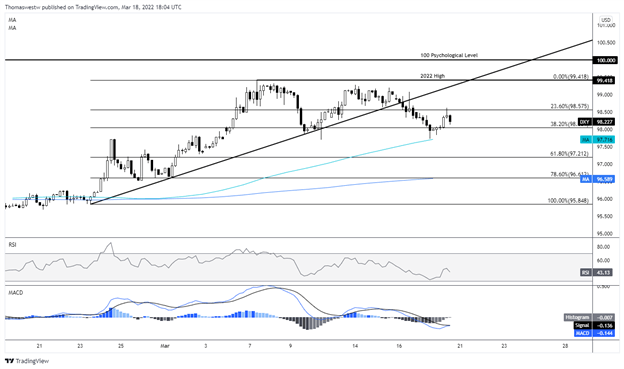
Chart created with TradingView
Trade Smarter - Sign up for the DailyFX Newsletter
Receive timely and compelling market commentary from the DailyFX team
EUR/USD Technical Forecast: Bearish
The Euro scored a win against the US Dollar, rising 1.23% for the first weekly gain since January. Still, prices remain near the yearly low, set just earlier this month. EUR/USD climbed above its 20-day Simple Moving Average but quickly surrendered those gains. Bulls would face the 50-day SMA near 1.1245 if prices manage to move higher.
However, a Bear Flag pattern has taken shape. That may result in a bearish continuation if prices break below flag support. The 2022 low at 1.0804 would shift into focus if that happened, possibly also opening up a route to test the 2020 low at 1.0636. The MACD line recently crossed below its signal line, indicating that upside momentum may be exhausted.
EUR/USD 4-Hour Chart
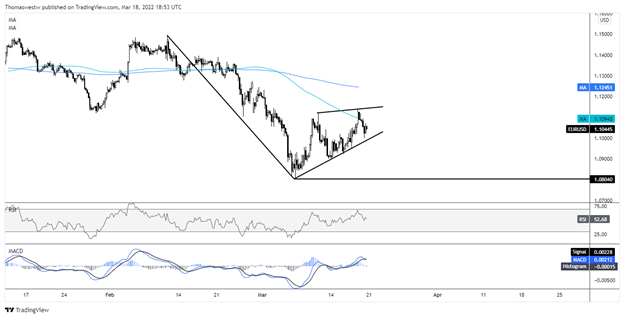
Chart created with TradingView
--- Written by Thomas Westwater, Analyst for DailyFX.com
To contact Thomas, use the comments section below or @FxWestwater on Twitter


