USD/CAD TECHNICAL OUTLOOK: SLIGHTLY BEARISH
- Market sentiment has improved in recent days, reducing demand for safe haven positions
- The Canadian dollar has recovered along with other risk assets, with USD/CAD down more than 1.1% in the last five sessions.
- After this week's pullback, USD/CAD is now sitting above a key support zone near 1.2600/1.2580. Price reaction around this area could determine the near-term outlook
Trade Smarter - Sign up for the DailyFX Newsletter
Receive timely and compelling market commentary from the DailyFX team
Most read: EUR/USD Caught Between Stiff Resistance and Big Support. What’s Next?
Market sentiment has improved in recent days. Despite the FOMC’s hawkish monetary policy outlook, we’ve seen a violent relief rally on Wall Street as traders began to unwind defensive positions. Risk-on flows have weighed on the DXY index, while supporting the Canadian Dollar. Against this backdrop, USD/CAD has fallen a little more than 1.1% in the last five days, dropping towards the 1.2600 psychological level just ahead of the weekend.
With the geopolitical crisis in Eastern Europe unresolved, it is hard to say whether the mood will stay positive, especially after Western intelligence services warned that Russia could start making nuclear threats if the war in Ukraine drags on too long. However, if the military conflict does not escalate or deteriorate in the coming days, high beta currencies could continue to perform well against the greenback.
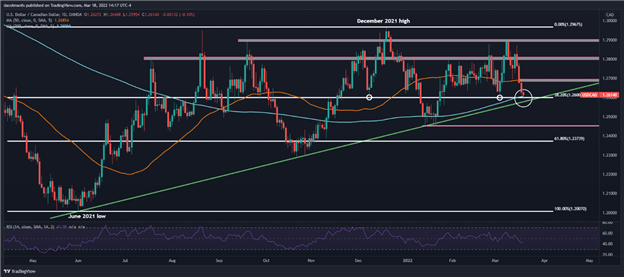
In any case, if we ignore fundamental analysis and focus on the technical outlook, we can see that USD/CAD is steadily approaching confluence support near 1.2600/1.2580, where a flawless rising trendline converges with the 200-day moving average and the 38.2% Fibonacci retracement of the June 2021/December 2021 leg higher.
| Change in | Longs | Shorts | OI |
| Daily | 6% | -11% | -5% |
| Weekly | 12% | -18% | -8% |
For short-term guidance and directional clues, traders should watch for price reaction around the 1.2600/1.2580 area in the coming sessions. If this line in the sand is breached on the downside in a decisive manner, sellers are likely to pounce on the breakout, reinforcing the bearish momentum and setting the stage for a move towards the next critical floor located near 1.2450, the 2022 lows. This scenario seems probable at the moment, with the RSI trending lower and sliding below the 50 region.
On the other hand, if USD/CAD is repelled from current levels and inflects higher, the first resistance to consider appears around 1.2685, the 50-day simple moving average. From here we can’t rule out a pullback, but if buyers manage to take out this ceiling, the 1.2800 handle would become the next upside target, followed by 1.2900.


USD/CAD TECHNICAL CHART

USD/CAD chart prepared using TradingView
EDUCATION TOOLS FOR TRADERS
- Are you just getting started? Download the beginners’ guide for FX traders
- Would you like to know more about your trading personality? Take the DailyFX quiz and find out
- IG's client positioning data provides valuable information on market sentiment. Get your free guide on how to use this powerful trading indicator here.
---Written by Diego Colman, Contributor


