


USD Technical Outlook: Bullish
- US Dollar Index (DXY) continues to run hard
- Strength has long-term resistance coming into focus
- Pullback to old resistance, new support could present opportunity

US Dollar Technical Forecast: DXY Ripping Towards 20-yr Trend-line
The US Dollar Index (DXY) continued its recent run of strength last week, and in the days/weeks ahead this could continue to be the case. Friday saw price rise above some minor levels from 2020, and now that the DXY is trading out in ‘open space’ a 20-year trend-line in focus. That level is currently over the 100-mark.
From a tactical standpoint, chasing the momentum presents the risk of a getting caught in a pullback in the near-term. Ideally, we do see a pullback, one that takes price back towards a test of recent levels in the vicinity of 98.25 down to 97.80. There is support from 2020 swing-highs as well as a top-side slope from November. Old resistance becomes new support.
A jab lower into support presents a potentially solid risk/reward entry to join the prevailing trend higher. If momentum is strong when approaching support it may be prudent to stand aside until we see price firm up a bit. A swift reversal from here that breaks support will turn the generally bullish outlook to neutral.
With the trend in favor of the upside and no good resistance levels in sight, fading strength for the sake of fading doesn’t appeal as a good risk/reward proposition.
US Dollar (DXY) Daily Chart
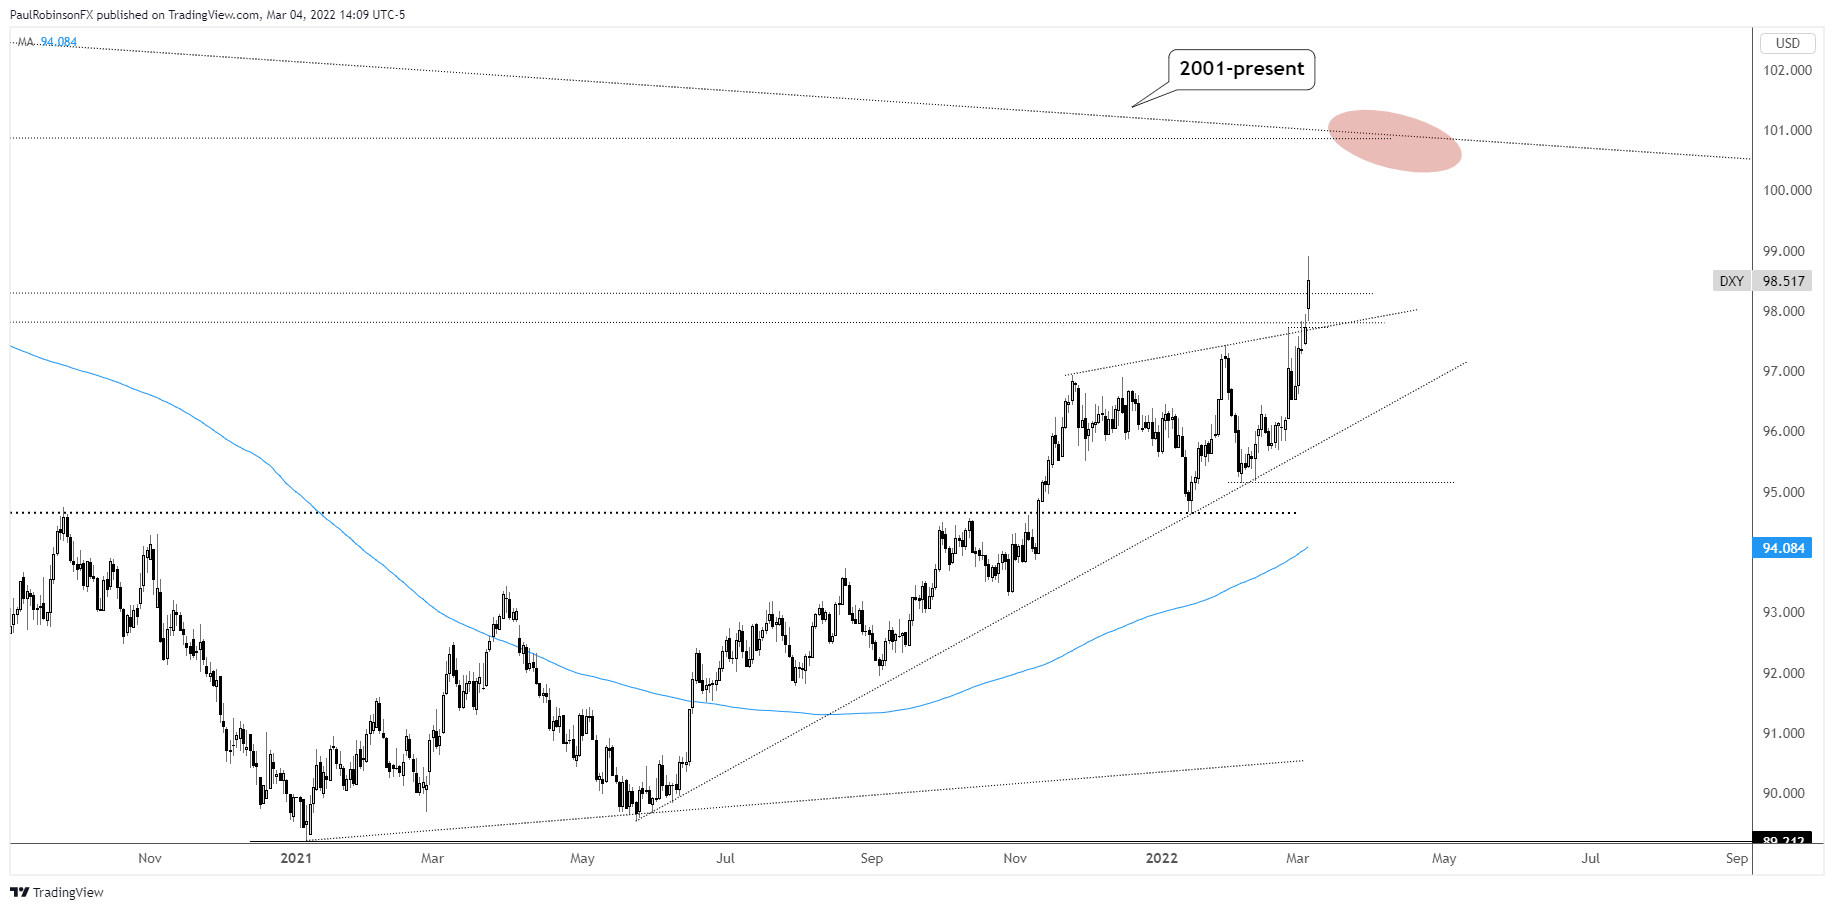
US Dollar Index (DXY) Chart by TradingView
Resources for Forex Traders
Whether you are a new or experienced trader, we have several resources available to help you; indicator for tracking trader sentiment, quarterly trading forecasts, analytical and educational webinars held daily, trading guides to help you improve trading performance, and one specifically for those who are new to forex.
---Written by Paul Robinson, Market Analyst
You can follow Paul on Twitter at @PaulRobinsonFX


