


Indices Technical Forecast: Bullish
- S&P 500 recovers as panic hits peak, more upside to come
- Nasdaq 100 7% Thursday rally kickstarts recovery mode
- Dow Jones just barely held big level, supported for now

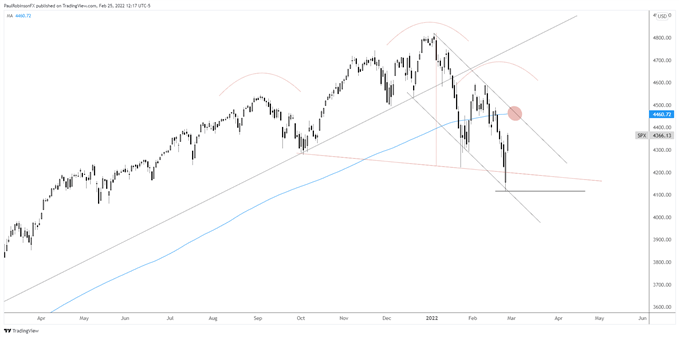
S&P 500 Technical Forecast The S&P 500 sold off into the days leading up to ‘invasion day’ on Thursday, and when Russia did finally invade the Ukraine the initial reaction was lower, but swiftly reversed. This wasn’t all that surprising as it marked a typical “buy the rumor, sell the news” scenario.
The gap-down was met with fierce buying pressure and suggests we will continue to see the market continue to recover in the days ahead. Other markets also responded in dramatic fashion, posting their own emphatic reversals. Oil and gold put in huge reversal candles suggesting at the very least we will see a short-term change in sentiment and trend.
The initial part of the gap on Thursday actually had the SPX on the verge of triggering a head-and-shoulders pattern, but the failure to confirm the pattern and close the day below the neckline made it all that more important of a threshold as support.
While the head-and-shoulders may eventually trigger, sending stocks much lower, for now it appears the SPX is set to continue towards the 200-day moving average (4460) and trend-line off the January high. That could be a decision point from which the market rolls back over, but we will have to wait and see how price action plays out on such a test before drawing further conclusions.
There is historical evidence that invasions can be intermediate-term bullish events. I’m not necessarily sold that this will be the case this go-around, but in the near-term conviction is bid that we will at least see higher before lower. This doesn’t mean gyrations won’t occur that spook the market, especially with a fluid war situation, but overall the bias is up looking into the week ahead.
S&P 500 Daily Chart
S&P 500 Chart by TradingView
Nasdaq 100 Technical Forecast
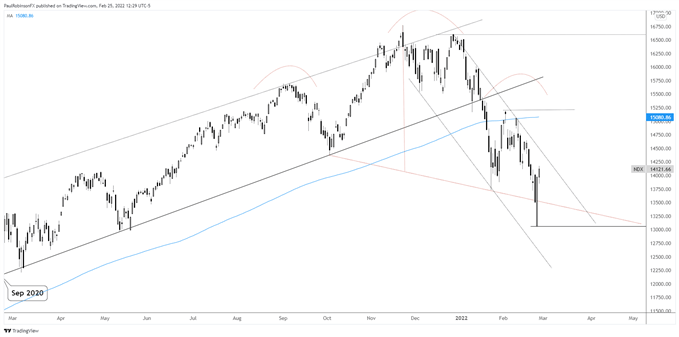
The Nasdaq 100 screamed back on Thursday to the tune of 7% from its worst levels, an impressive feat on the heels of a panicking market. The gap-down was quite a bit below the neckline of a broad H&S pattern, but again like the S&P 500 it didn’t officially trigger as the market closed well above the neckline.
There is some resistance via the December trend-line just ahead, but the thinking is that the NDX will climb further than that even if it is to roll back over later on. Last week’s low at 13065 will be key to hold if the recovery scenario is to maintain. Seems unlikely it will get tested if the market is going to bounce, but it can’t be ruled out with vol elevated.
Nasdaq 100 Daily Chart
Nasdaq 100 Chart by TradingView
Dow Jones Technical Forecast
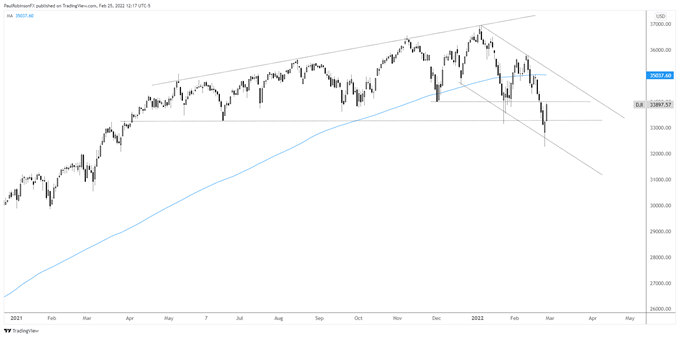
The Dow Jones very nearly confirmed its own big break of support dating to March of last year. The gap on Thursday had the index below, but by the end of the session it had closed right above the line (33150). Upside is anticipated with the rest of the market, with the Jan trend-line and 200-day moving average as potential targets.
Dow Jones Daily Chart
Dow Jones Chart by TradingView
Resources for Forex Traders Whether you are a new or experienced trader, we have several resources available to help you; indicator for tracking trader sentiment, quarterly trading forecasts, analytical and educational webinars held daily, trading guides to help you improve trading performance, and one specifically for those who are new to forex.
---Written by Paul Robinson, Market Analyst You can follow Paul on Twitter at @PaulRobinsonFX


