


U.S. Indices Technical Forecast: Neutral to Bearish
- S&P 500 in a vulnerable state but may not decline just yet
- Nasdaq 100 could struggle to trade much above the 200-day
- Dow Jones has less clarity, but will follow overall market

Dow Jones, S&P 500, Nasdaq 100 Forecast: Outlook Turns Dicey Again
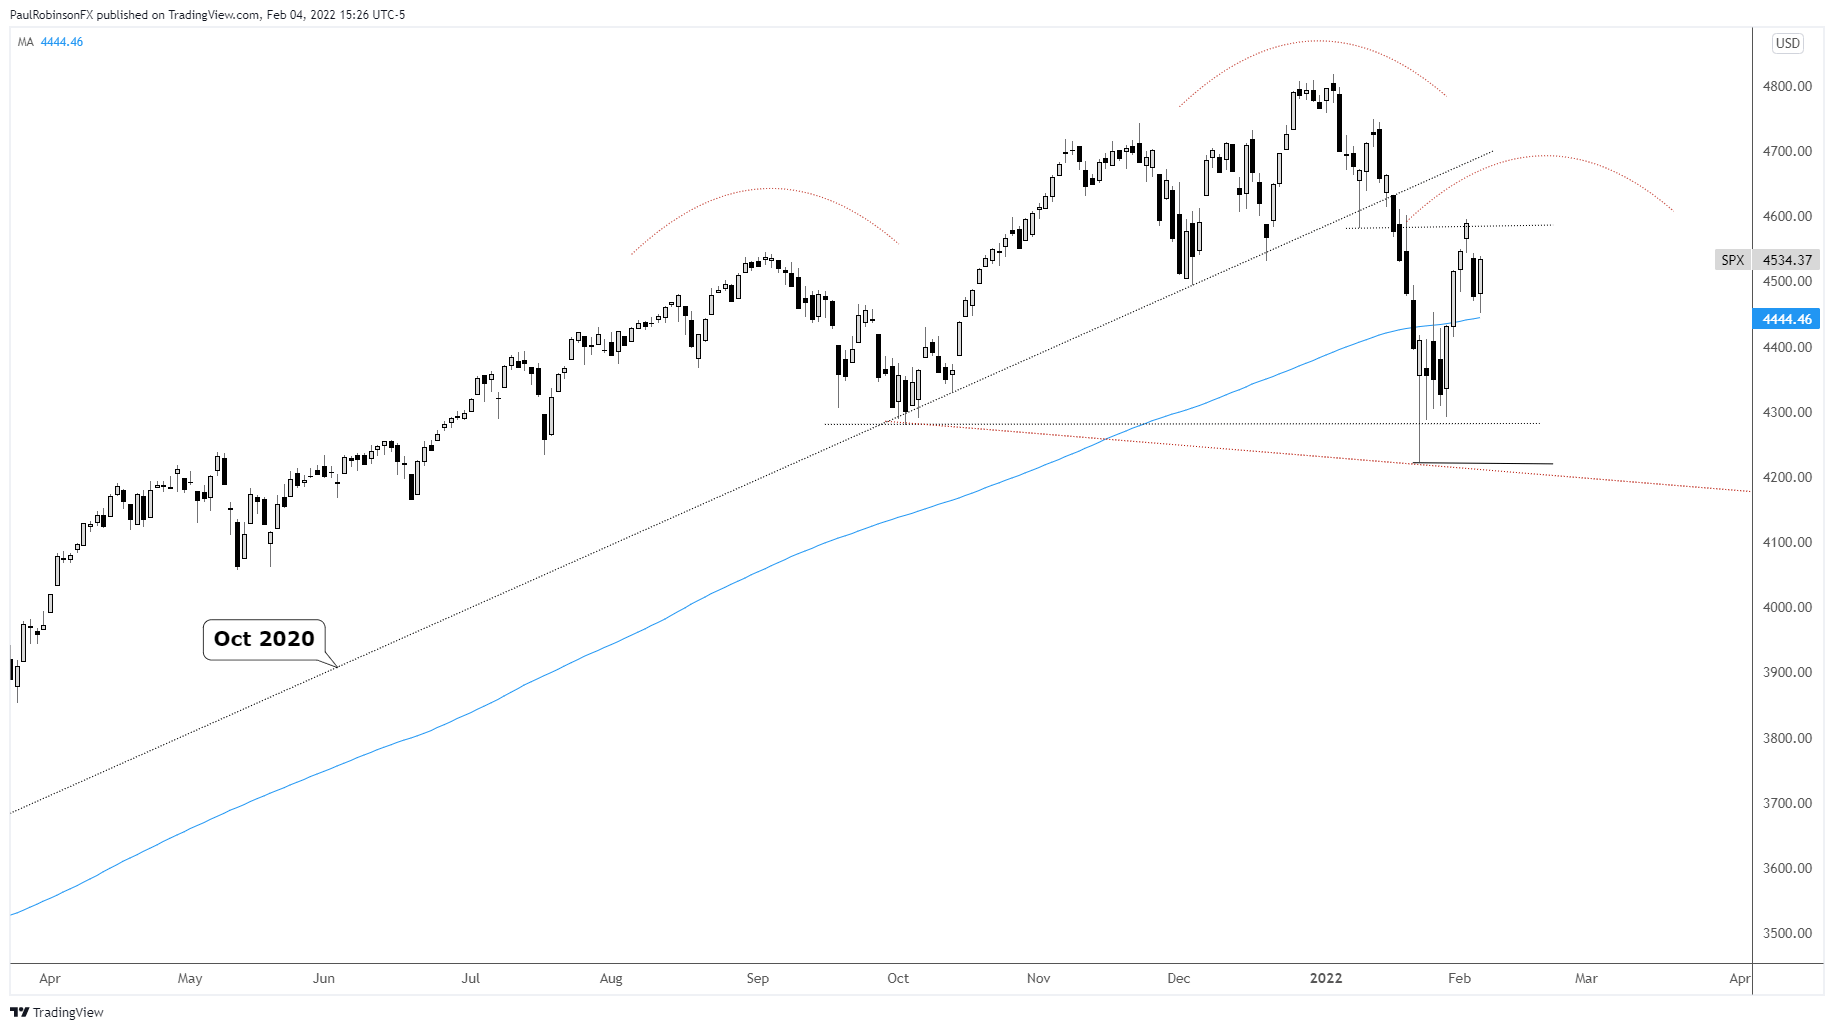
The S&P 500 continued its spring off recent lows, but found a bit of resistance around the January 10 low. What I will be watching for in the week ahead is if that recent high can maintain or at least maintain on a closing basis.
A close above 4595 could open up more room for further gains, but those gains will still be viewed through a skeptical lens as the broader technical picture has weakened quite a bit. In the week ahead we may not see the market have a meltdown, but rather bobble around as the market makes sense of the recent volatility.
In due time, though, risk looks high that we will see the market roll over in a meaningful manner that takes out the January low at 4222 by a wide margin. A head-and-shoulders top, with the left shoulder in September and head in January, could develop if we see recent highs hold or thereabout, creating the right shoulder.
It will take a sizable drop below the Jan low will need before triggering the pattern, but it is certainly a possibility . The right shoulder needs a little more time to mature for the sake of creating better symmetry on the pattern, hence the thinking that we may not be ready yet to roll over.
Overall, though, the general trading bias on this end leans neutral to bearish.
S&P 500 Daily Chart
The Nasdaq 100 is starting to etch out a head-and-shoulders pattern like the S&P 500. This comes after breaking the bull channel dating to September 2020. It could be that price action is capped on the upside by the 200-day moving average just over 15k, but if not it isn’t viewed that the NDX will be able to climb over the underside parallel of the bull channel if the market is to eventually head materially lower.
Nasdaq 100 Daily Chart
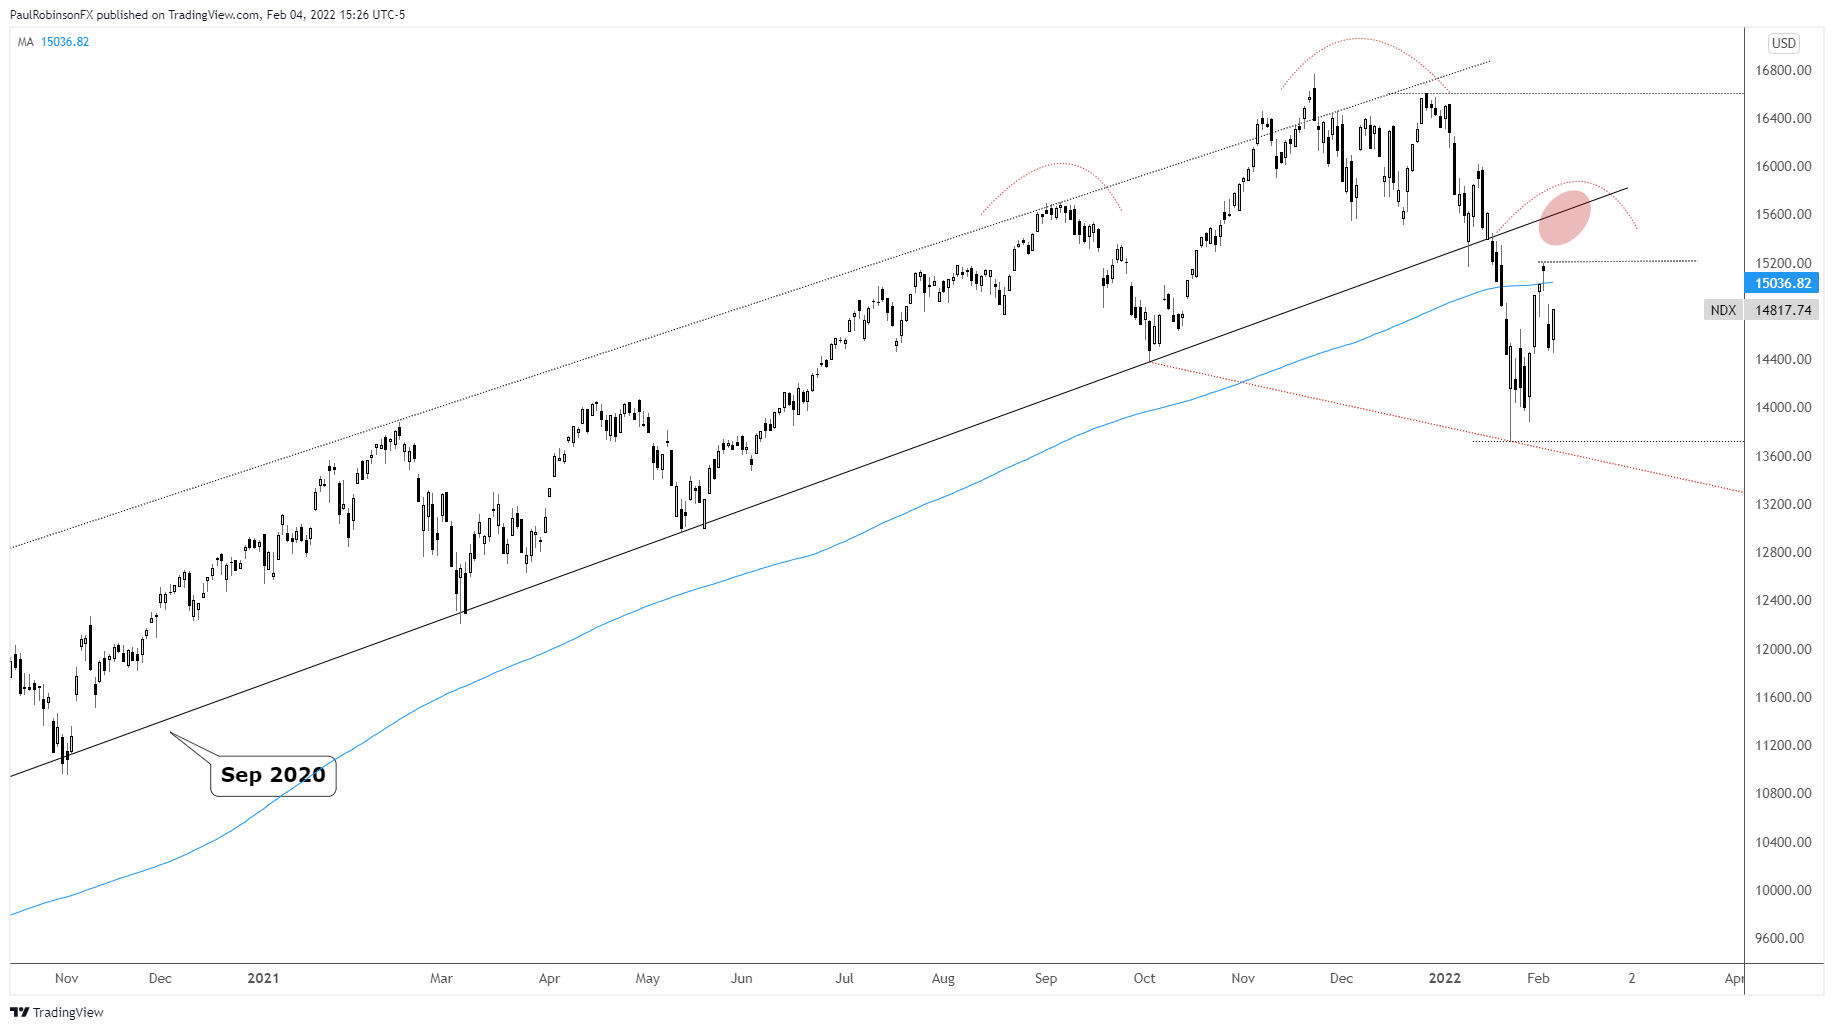
Nasdaq 100 Chart by TradingView
The Dow Jones presents less clarity than the S&P 500 and Nasdaq 100, but obviously if we see a broader move lower in risk then the Dow will go with it. There is a lot of support below from 34k down to the Jan low at 33150. Short-term resistance clocks in at 35679.
Dow Jones Daily Chart
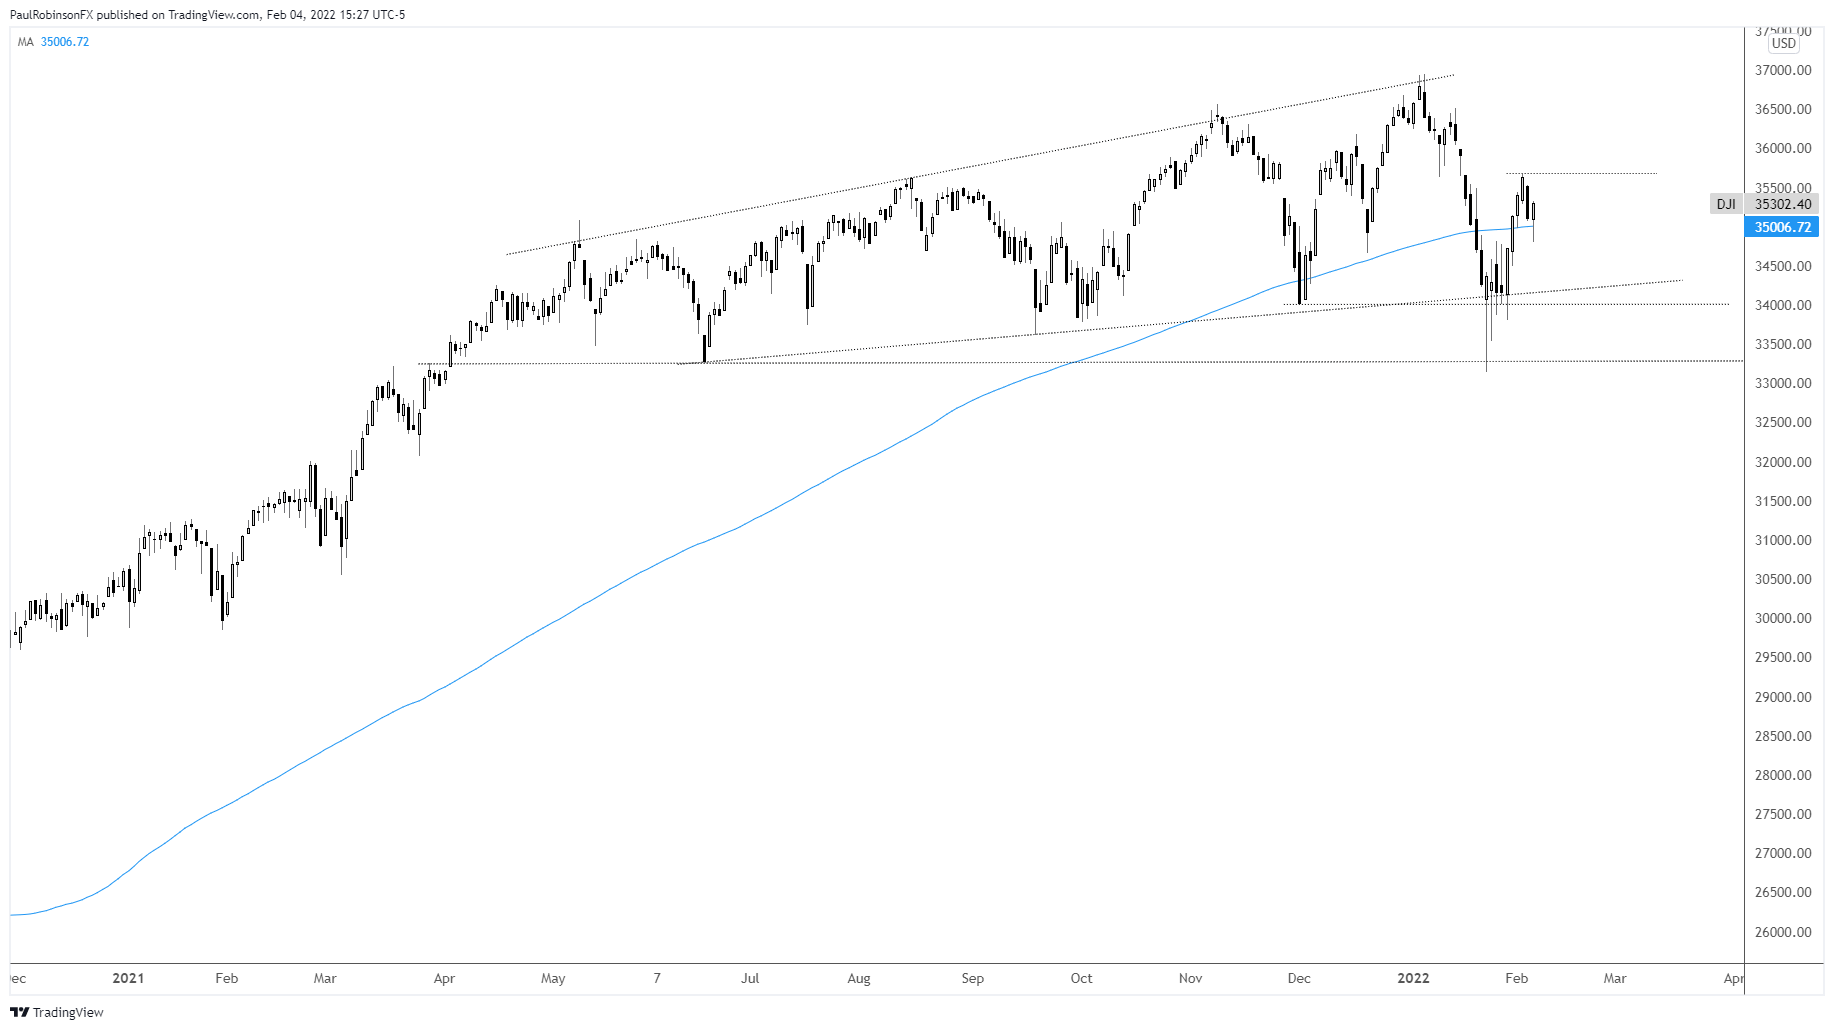
Dow Jones Chart by TradingView
Resources for Forex Traders
Whether you are a new or experienced trader, we have several resources available to help you; indicator for tracking trader sentiment, quarterly trading forecasts, analytical and educational webinars held daily, trading guides to help you improve trading performance, and one specifically for those who are new to forex.
---Written by Paul Robinson, Market Analyst
You can follow Paul on Twitter at @PaulRobinsonFX


