


Gold Price Technical Outlook: Neutral
- Gold is declining towards a big level of support
- Major horizontal level helped by confluent trend-line

Gold Price Forecast – XAU/USD Declining Towards Big Spot on Charts
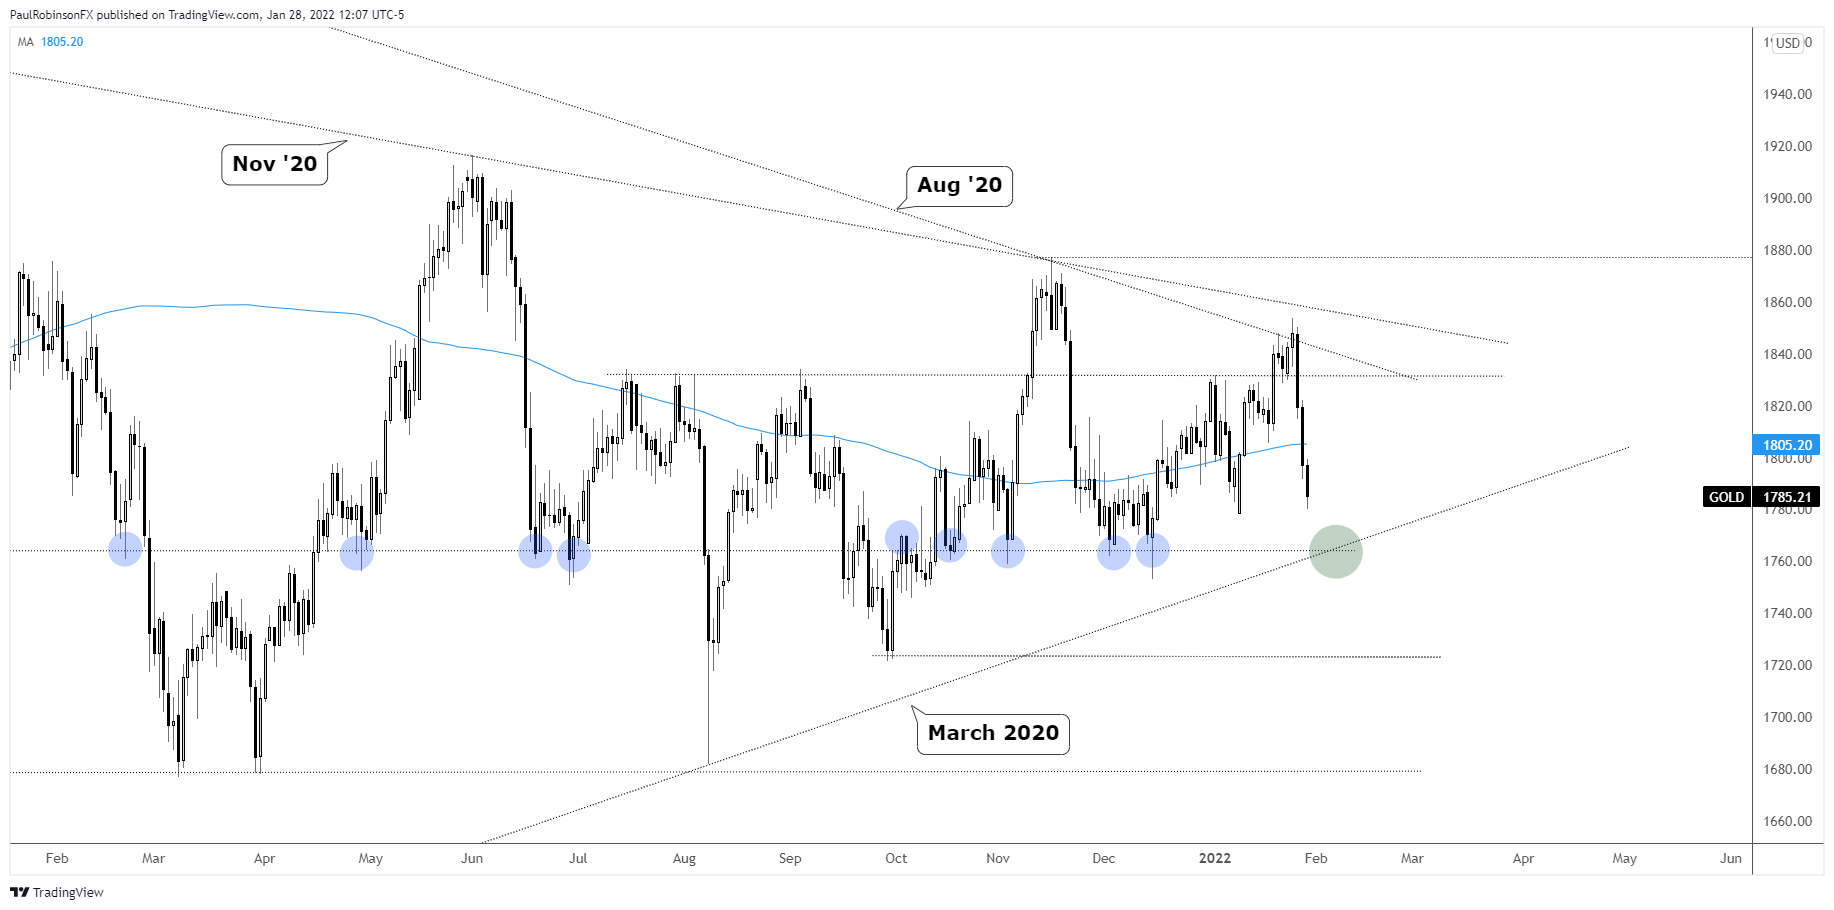
Gold has been getting hammered the past few sessions while the USD drives higher. This is bringing into view a significant level of support as a new week arrives. Since May 2020 we have seen the area around 1765 come into focus on numerous occasions.
By my count it has been in play around 11 times over that period, with five of the occurrences happening since early October. This is what makes a level highly meaningful, repeated tests, and in this case, mostly tests as support.
It hasn’t always been perfect, there have been one to two-day moves that have gone through, but overall you can see (blue circles) that it’s an area of support, give or take a few handles, that has cemented itself an important one. Further bolstering strong horizontal support is the trend-line running up from the March 2020 low, with the August 9 flash-crash low as its connecting point.
Even if gold is to continue to decline in a meaningful way, the thinking is we will at least see some type of reaction off notable support. Watch for signs of a capitulation, such as a sharp reversal day or just a strong late session bounce off the lows that keeps support intact. In any event, what matters is that a daily close develops just around support, but preferably well above.
A test and rejection could set into motion a short-term bounce for starters, then we would need to monitor price behavior from there. On the flip-side, if support doesn’t hold then much lower prices could quickly be seen as a major level is finally breached.

Gold Price Daily Chart
Resources for Forex Traders
Whether you are a new or experienced trader, we have several resources available to help you; indicator for tracking trader sentiment, quarterly trading forecasts, analytical and educational webinars held daily, trading guides to help you improve trading performance, and one specifically for those who are new to forex.
---Written by Paul Robinson, Market Analyst
You can follow Paul on Twitter at @PaulRobinsonFX


