


The Canadian dollar ended the week on a strong note, boosted by a USD sell-off and higher oil prices but trades near a ‘make or break’ decision point
Loonie (CAD) Weekly Technical Forecast: Bullish, Upon Trendline Bounce

Since bottoming out in June of 2021, USD/CAD has made a rather choppy attempt at forging a longer-term uptrend. For the most part, the pair has printed higher highs and higher lows but the recent US dollar sell-off brings USD/CAD perilously close to the lower bound of the ascending channel and marks two consecutive weeks of sizable declines.
USD/CAD Weekly Chart
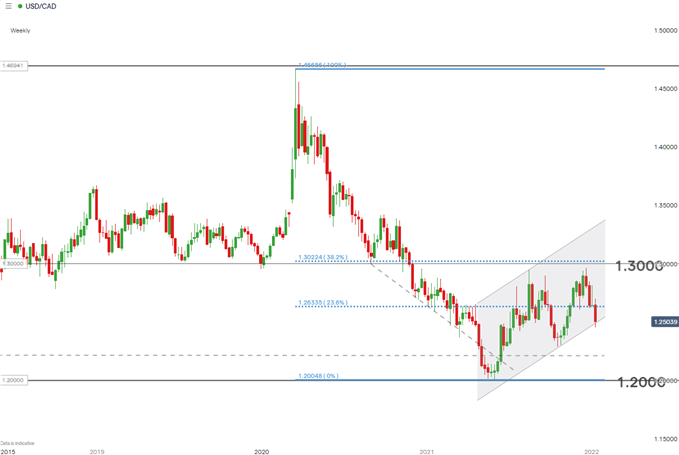
Source: IG, prepared by Richard Snow
The daily chart helps view recent price action in a more granular form. Firstly, the trend following, momentum indicator, the MACD, shows the MACD line continuing below the signal line with both lines appearing below the ‘0’ line – suggesting bearish trend continuation. The Relative Strength Indicator (RSI) approaches but has not yet dipped into overbought territory suggesting that there may be some further selling ahead. A break below the trendline leaves plenty of room for USD/CAD to drop, as the next significant zone of support lies between 1.2275 and 1.2310 before 1.2220.
While prices may continue lower we are starting to see what looks like a slow-down in the USD sell-off which can be seen on the USD/CAD chart below as yesterday’s closing candle printed a moderate lower wick – signaling a rejection of lower prices. At the time of writing, Friday’s daily candle also exhibits a moderate lower wick while trading close to flat on the day. Considering this alongside the proximity to trendline support, goes someway to supporting a potential reversal play once confirmed. Areas to watch for greater conviction in the reversal narrative come in at 1.206 and the 23.6% Fibonacci level (drawn from the March 2020 high to the 2021 low) at 1.2635.
Brush up on how to read candlestick charts via our complete guide.
USD/CAD Daily Chart
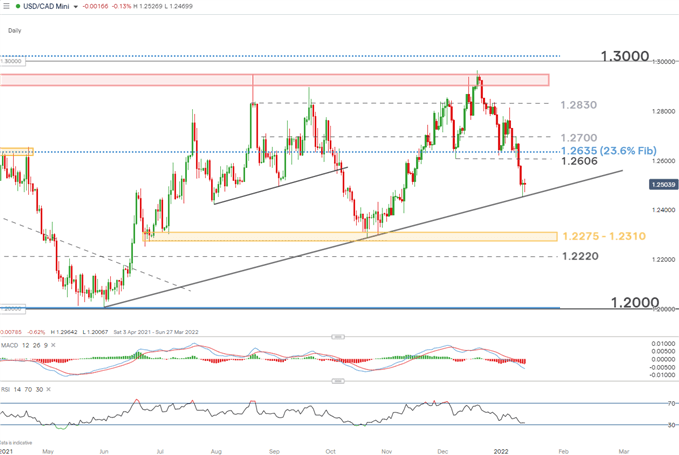
Source: IG, prepared by Richard Snow
Major Risk Events for the Week Ahead
The economic calendar looks rather light for the US and Canada over the upcoming week. The major data points are headline and core CPI (inflation) data in the lead up to the Bank of Canada’s first meeting of the year on January the 22nd where it is largely anticipated that we will see a rate hike from 0.25% to 0.5%.
DailyFX Economic Calendar
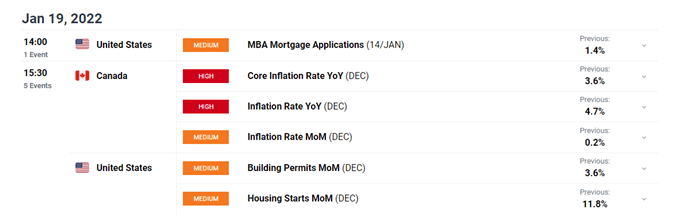
Customize and filter live economic data via our DaliyFX economic calendar
Rates markets currently price in around 78% chance of a hike.
Implied Probability of a Rate Hike on Jan 26th
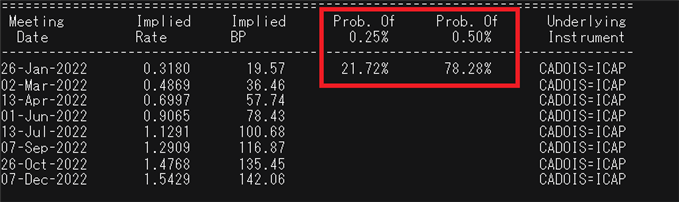
Source: Refinitiv, via CADOIS
Trade Smarter - Sign up for the DailyFX Newsletter
Receive timely and compelling market commentary from the DailyFX team
--- Written by Richard Snow for DailyFX.com Contact and follow Richard on Twitter: @RichardSnowFX


