


GBP/USD TECHNICAL FORECAST: BULLISH
- Expected UK policy rates showing rapid rate hike after November.
- GBP/USD rally in doubt after questionable forecast.
- Sentiment favors short-term upside.
POUND FUNDAMENTAL BACKDROP
Sterling has been one of the strongest major currencies against the U.S. Dollar of recent with impetus from a hawkish Bank of England (BoE) as well as a marginally weaker greenback. Both nations have begun a divergence in terms of their central bank policies where the Fed is only looking to begin tapering asset purchase while the BoE is already eyeing rate hikes as soon as November 2021 (see graphic below for comparison).
The implied forward SONIA fixing shows the market expectation of UK interest rates in the future. The curve indicates that markets project a quick succession of rate hikes from November 2021 through to the end of 2022.
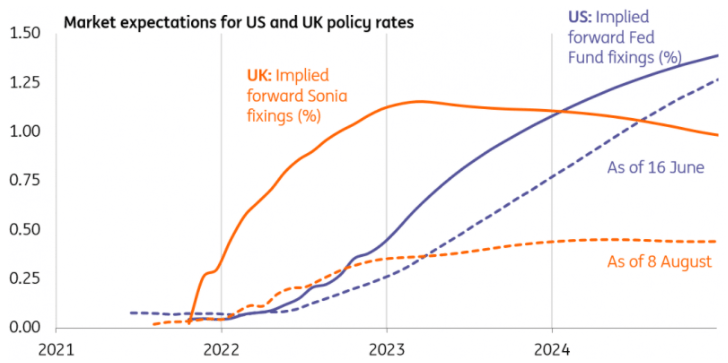
Source: ING
With inflation figures running above target it seems the BoE does not adapt to the transitory camp however financial markets are far more hawkish if the above graph is anything to go by. Could this be premature and will the pound rally fade into a correction to the downside medium-term?
GBP/USD TECHNICAL ANALYSIS
GBP/USD Daily Chart
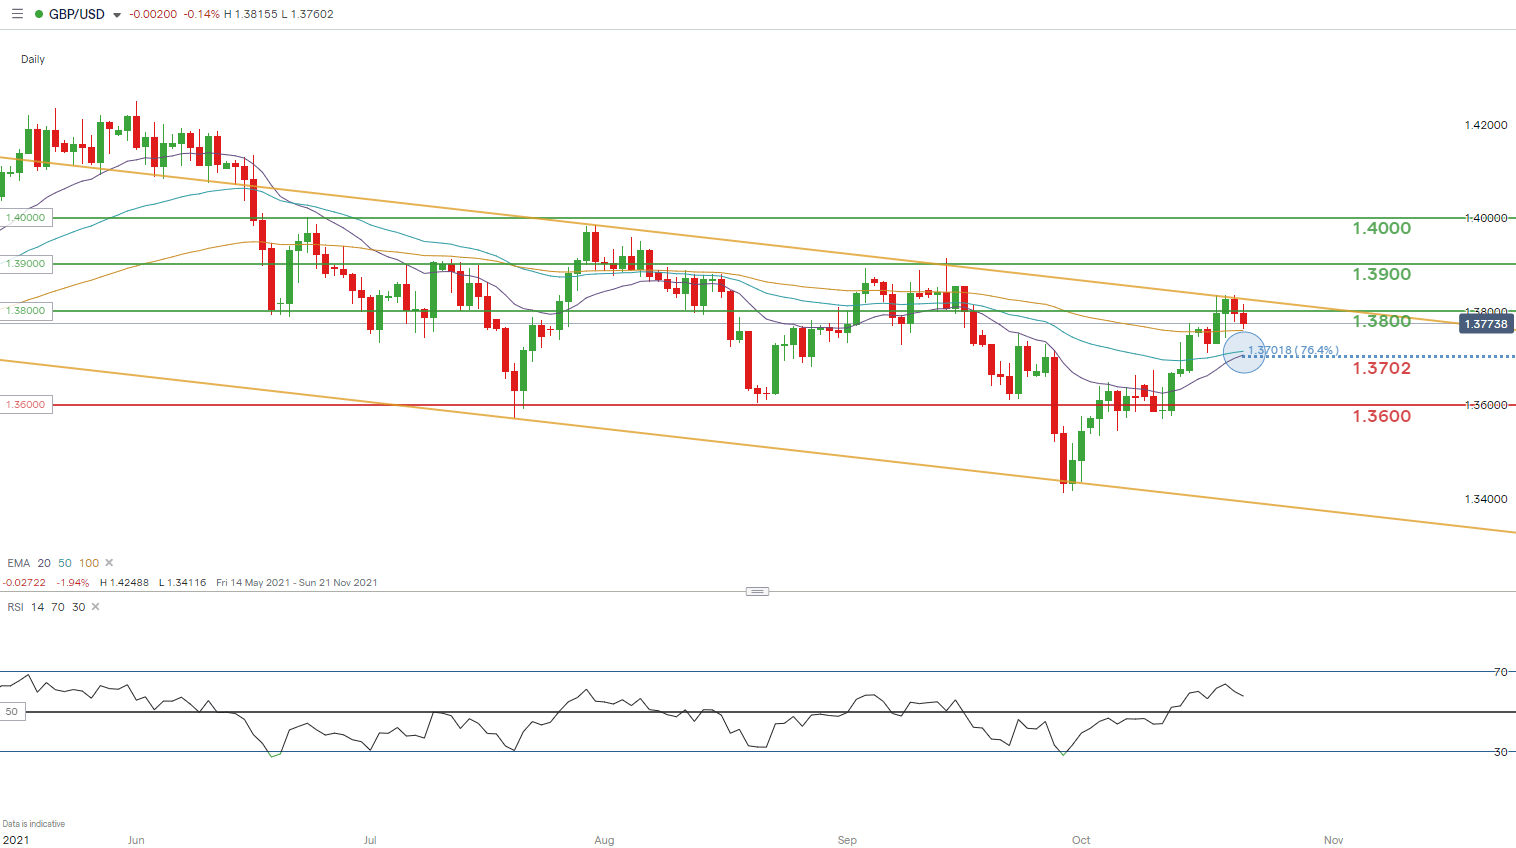
Chart prepared by Warren Venketas, IG
The daily GBP/USD chart above shows the pair trading within a channel formation (yellow) since mid-June 2021. Price action shows bulls challenging channel resistance which could provide short-term guidance depending on whether we see a breakout or continuation within the channel.
The Relative Strength Index (RSI) is trading at its highest since May 2021 but there is still room for further upside before entering overbought territory. This could mean an extension of the current bullish move as the first rate hike looms, after which a drop off in upside momentum as markets possibly revise their extreme rate expectations.
A bullish Exponential Moving Average (EMA) crossover threatens (blue), whereby the 20-day EMA is pushing towards the 50-day EMA. Should this reveal, there would be more impetus behind the move towards 1.3900.

Key resistance levels:
- 1.4000
- 1.3900
- Channel resistance (yellow)
- 1.3800
Key support levels:
- 1.3702
- 1.3600
IG CLIENT SENTIMENT DATA POINTS TO A NEAR TERM BULLISH BIAS
IG Client Sentiment Data (IGCS) shows retail traders are currently noticeably short on GBP/USD, with 54% of traders currently holding short positions (as of this writing). At DailyFX we typically take a contrarian view to crowd sentiment, and the fact traders are net-short is suggestive of further upward momentum on the index.
--- Written by Warren Venketas for DailyFX.com
Contact and follow Warren on Twitter: @WVenketas


