


US Dollar Technical Forecast: Bearish
- The US Dollar sold off again this week, helped along by an abysmal NFP print released on Friday.
- DXY made a fast approach towards a big zone of support that currently holds the two-month-low.
- The analysis contained in article relies on price action and chart formations. To learn more about price action or chart patterns, check out our DailyFX Education section.

It was another week of losses for the US Dollar, continuing the sell-off from the prior week after the currency had topped out on the previous Friday. Cumulatively, the two-week sell-off has nearly wiped out the entirety of the gains from the mid-August rally: Price action in the USD is heading towards the same spot of support that helped to hold the lows in late-July into early-August. This runs between confluent Fibonacci levels plotted at 91.82 and 91.93, with the latter of those prices being the 38.2% retracement of the 2011-2017 major move.
Introduction to Technical Analysis
Fibonacci
Learn more about Fibonacci with DailyFX Education
US Dollar Eight-Hour Price Chart

Chart prepared by James Stanley; USD, DXY on Tradingview
Taking a further step back on the chart and we can see where the US Dollar is holding to the scenario looked at in the Q3 technical forecast on the USD. In that forecast I was largely looking for mean reversion, and while we did get a quick trip up to a fresh high, that move was fleeting and prices soon start to break back-down.
And at this point, it seems as though there may be scope for more weakness: At Jackson Hole in August, Jerome Powell said the US economy had not quite met the mark for ‘significant forward progress’ in terms of employment. And then August Non-farm Payrolls came out abysmally bad, and this doesn’t exactly provide for strong context going into the September FOMC rate decision. So it’s difficult to imagine how the Fed could get more hawkish here, especially as Covid case numbers continue to rise. The seemingly bearish fundamental backdrop meshes with the current bearish trend, and this allows for a bearish forecast for the USD going into next week.
US Dollar Technical Forecast: Bearish
US Dollar Monthly Price Chart
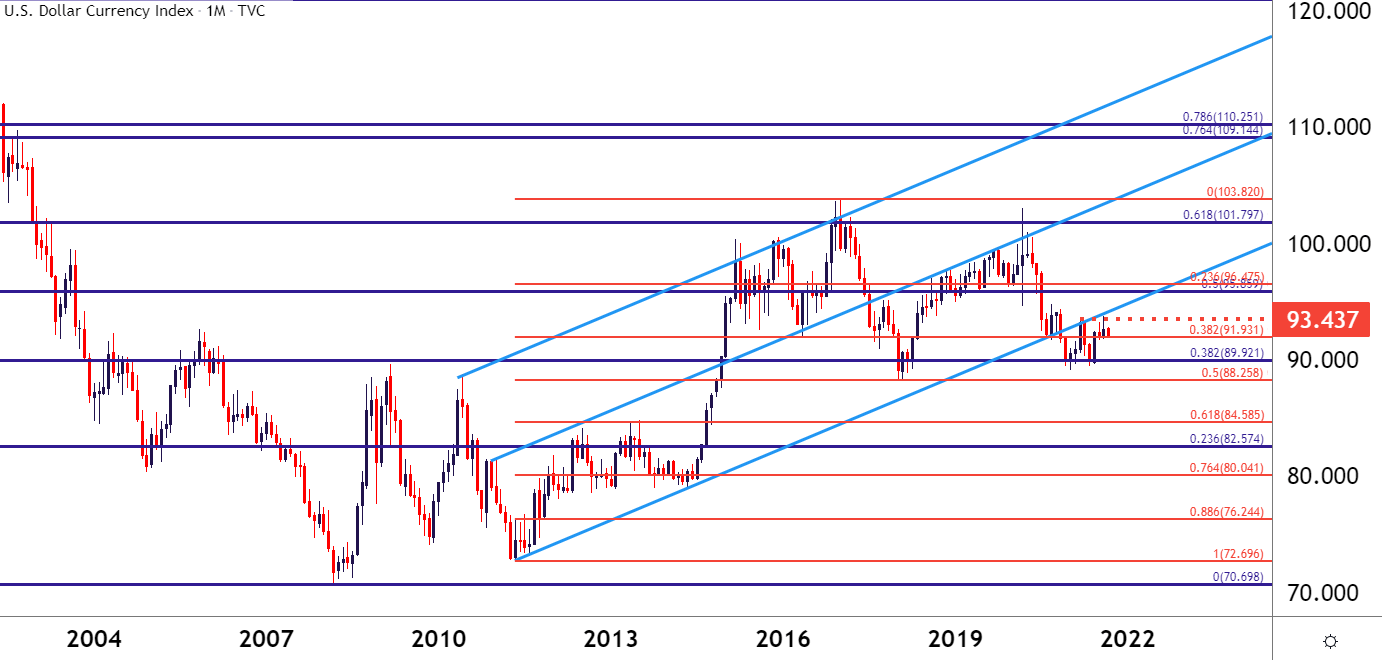
Chart prepared by James Stanley; USD, DXY on Tradingview
--- Written by James Stanley, Senior Strategist for DailyFX.com
Contact and follow James on Twitter: @JStanleyFX


