


DAX 30, S&P 500, and FTSE 100 FORECAST: BULLISH
- S&P 500 continues to outperform as European equities fall slightly behind
- FTSE 100 struggling to find a direction

Global stocks have staged a mixed performance this week as investors set their eyes on the Jackson Hole Symposium whilst Covid-19 cases shot up worldwide. The approval of the Pfizer vaccine by the FDA has been one of the main drivers keeping stocks higher this week, but there is no denying that there are still risks out there putting pressure on their performance, most notably the continued spread of the virus and ongoing talk about tapering asset purchases, which would start to reduce the amount of liquidity in the markets.
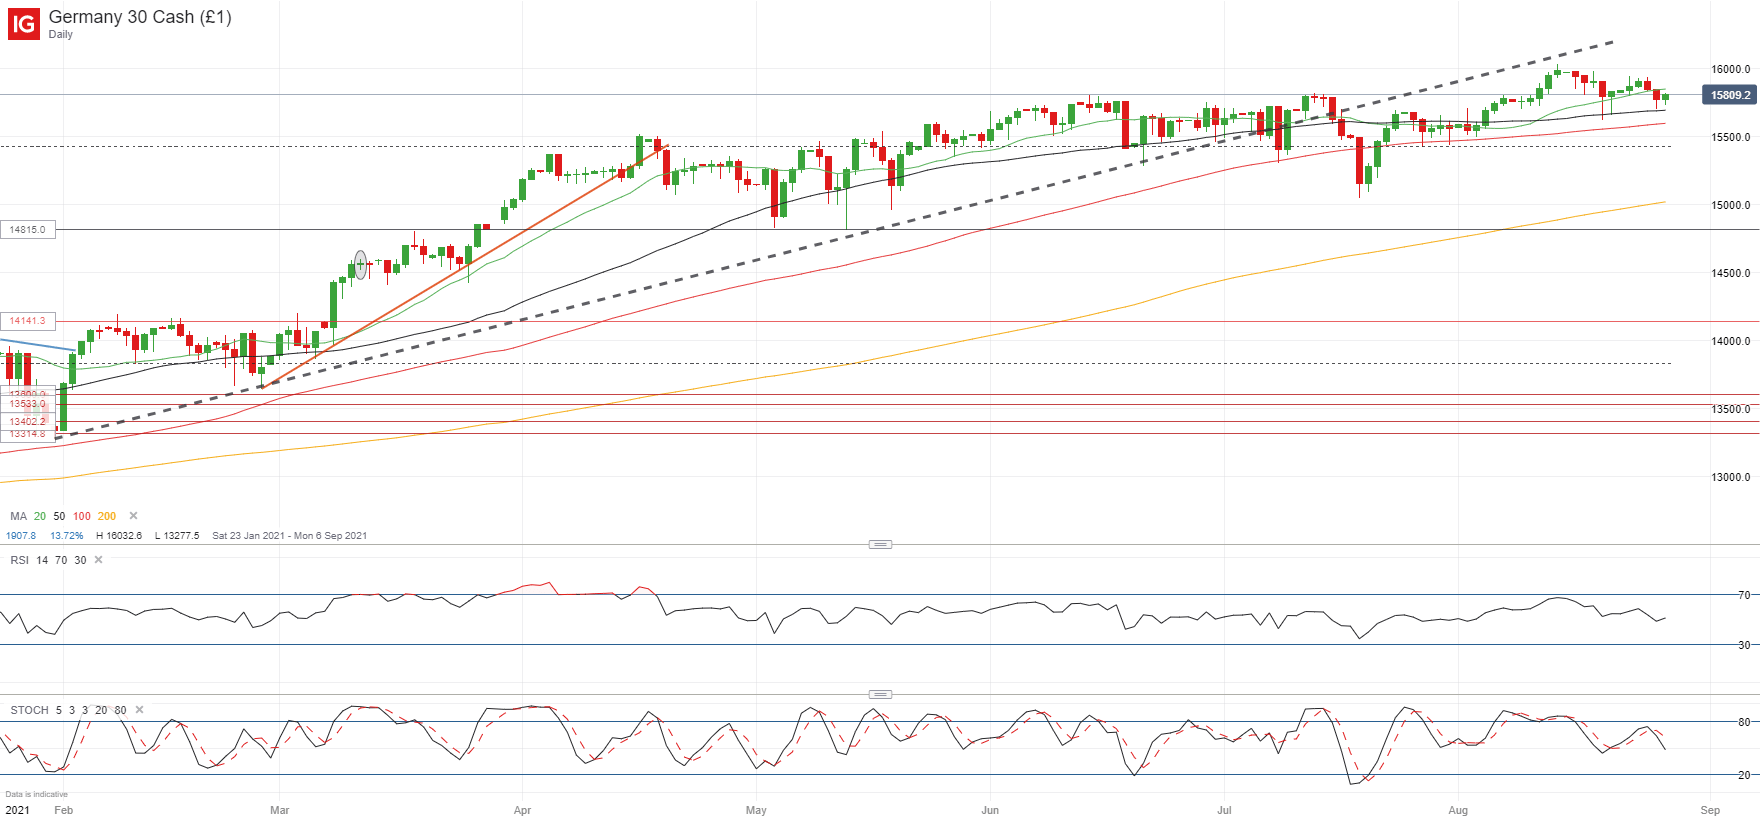
DAX 30 KEY LEVELS
The DAX 30 seems well supported for now if a further pullback arises and so momentum is likely to stay tilted to the upside in the short-run. The area between the 50-day SMA (15,693) and the 100-day SMA (15,596) is likely to continue offering support into the new week, but any further bearish pressure is likely to find some resistance at the 127.2% Fibonacci extension at 15,424. The ultimate test of the bullish trend will be the 15,000 mark, where the 200-day SMA is converging, at which point we could see the trend turn bearish after months of consolidation.
DAX 30 Daily Chart
S&P 500 KEY LEVELS
The S&P 500 has continued its bullish run despite the pullback seen last week, as the index is following a clear technical pattern of small retracements to gather momentum and break higher. Again this past week it has reached a new all-time high and it wouldn’t be a surprise if it happens again this coming week. The area to beat now is 4,500, at which point we may see a drift higher towards 4,520 before some profit-taking kicks in. If so, the ascending trendline (4,410) is likely to offer renewed support for another break higher down the line.
S&P 500 Daily Chart

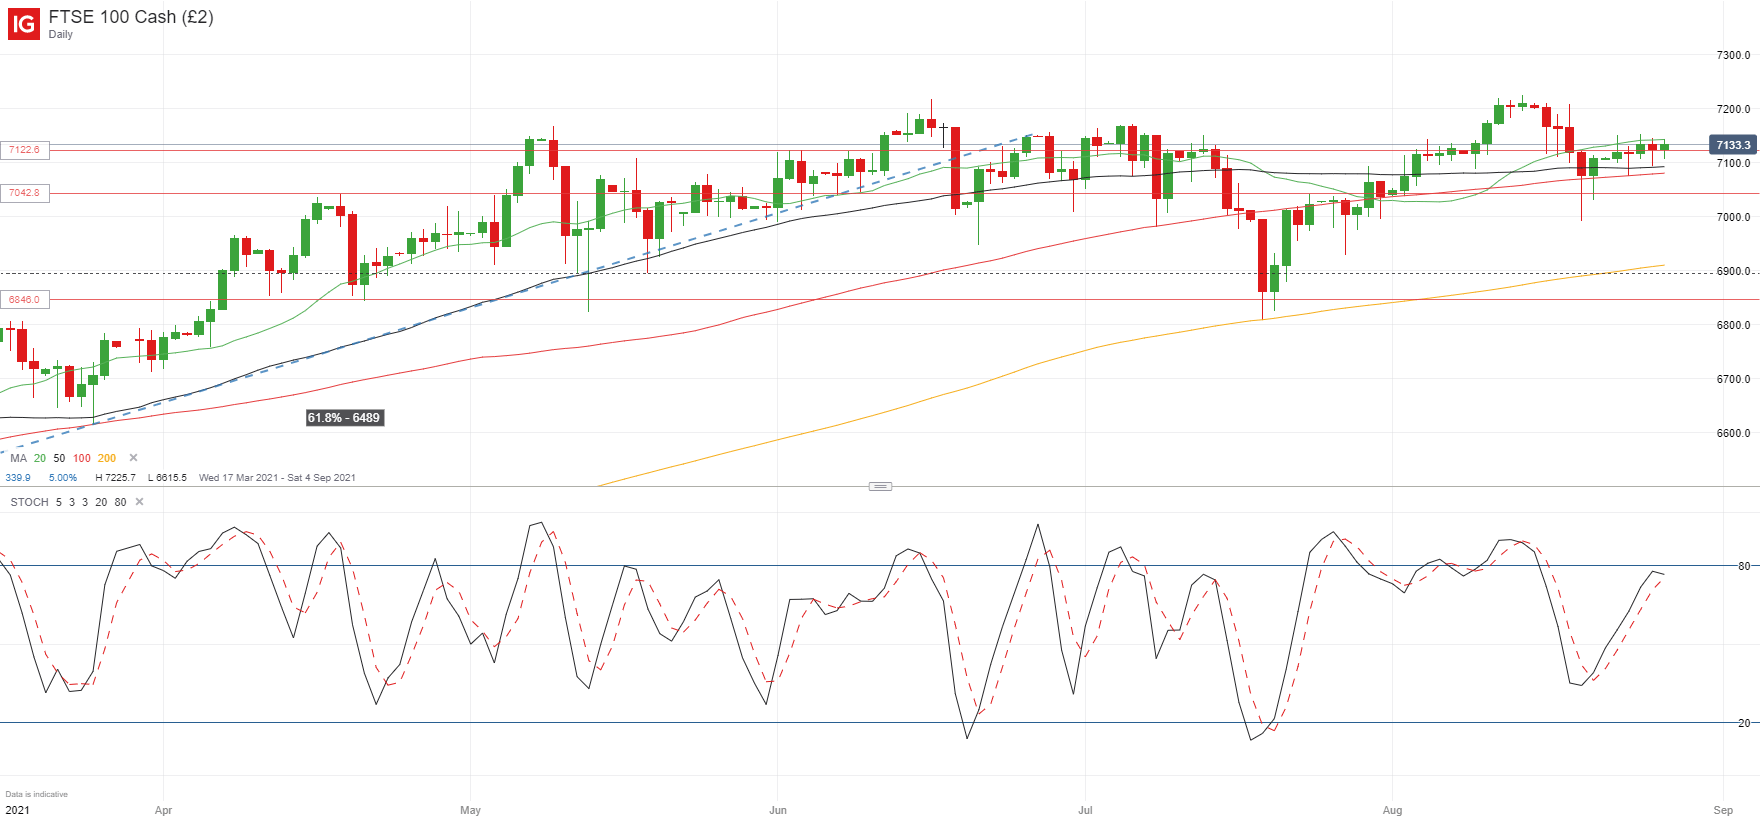
FTSE 100 KEY LEVELS
The FTSE 100 has been slightly disappointing as of late, having stayed within a tight range over the last few sessions despite good attempts to break on either side of 7,120. Even the tails of the candlesticks have been shortening, following smaller bodies along the past week, which may be signaling that momentum is stalling as investors await for the next catalyst to determine direction. The downside seems well supported between 7,092 and 7,080 with further retracement likely to find buying pressure around the 7,000 mark. On the upside, the 7,200 area is likely to be a short-term target for buyers.
FTSE 100 Daily Chart
Learn more about the stock market basics here or download our free trading guides.
--- Written by Daniela Sabin Hathorn, Market Analyst
Follow Daniela on Twitter @HathornSabin


