


Nasdaq 100 index Technical Forecast: BEARISH
- The Nasdaq 100 index brokethe 20-Day SMA line and opened the door for further losses
- The MACD indicator trended lower, forming a bearish divergence
- Hong Kong’s Hang Seng Index (HSI) is testing a key support level at 24,850 amid a bearish trend

Nasdaq 100 – Daily Chart
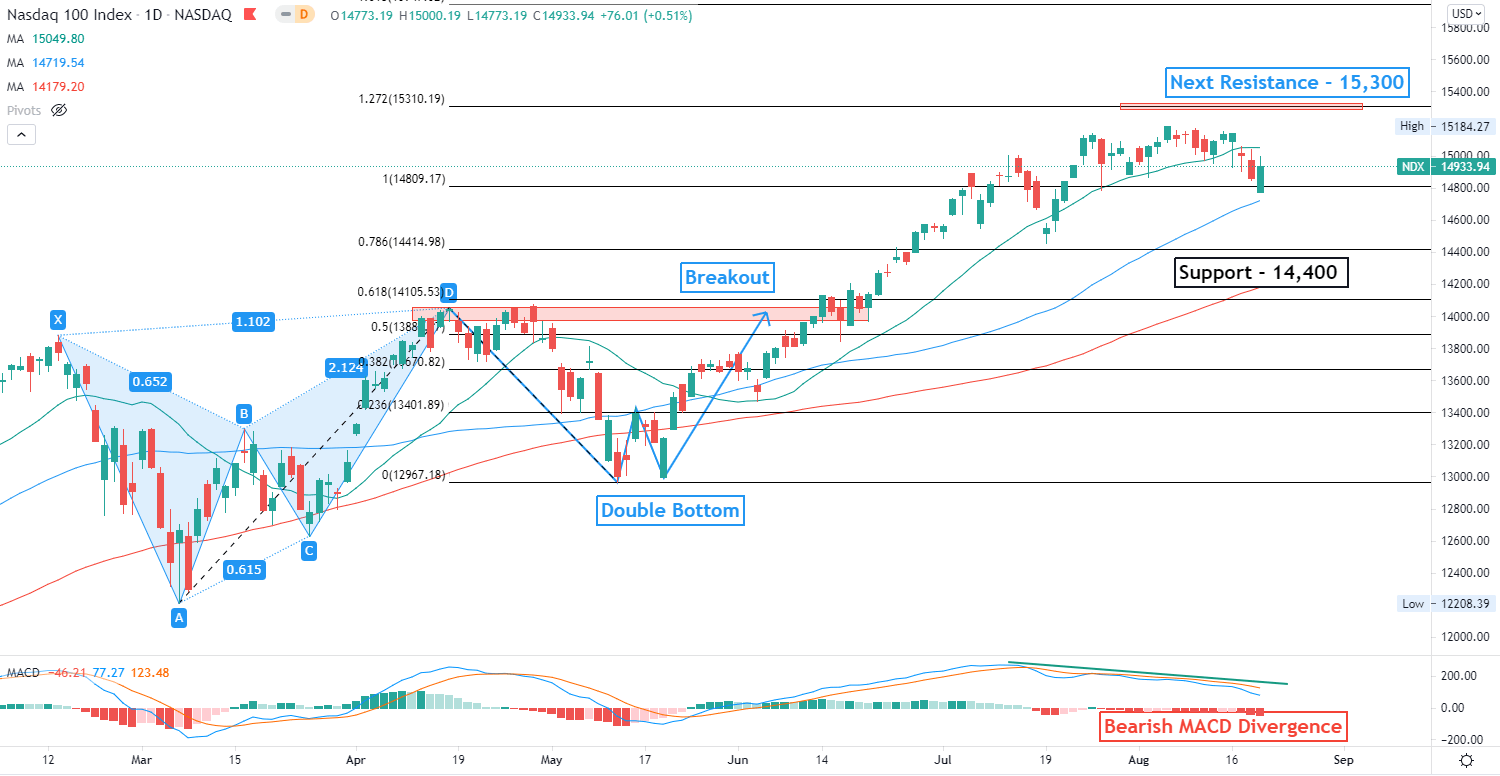
Chart created with TradingView
The Nasdaq 100 index pulled back from all-time highs last week and entered a technical correction. Prices breached below the 20-Day SMA line, exposing the next support level at 14,400 – the 78.6% Fibonacci extension. If prices stabilize and turn higher however, 15,300 (127.2% Fibonacci extension) may be the next key resistance level to watch out for.
The MACD indicator retreated from recent highs and trended lower, forming a bearish divergence with prices. This suggests that upward momentum may be weakening. The Nasdaq 100 registered an eye-watering gain of 16.8% since the “Double Bottom” pattern formed at the end of May, rendering it susceptible to a technical pullback when profit-taking kicks in.
Hang Seng Index (HSI) – Daily Chart

Chart created with TradingView
The Hang Seng Index (HSI) fell sharply and breached a “Descending Channel” last week amid Beijing’s regulatory crackdown on the private sector. The index is testing a key support level at 24,850 – the 78.6% Fibonacci retracement. The overall trend remains bearish-biased, as suggested by the downward-sloped SMA lines. The MACD indicator formed a bearish crossover and trended lower, suggesting that selling pressure may be prevailing.

--- Written by Margaret Yang, Strategist for DailyFX.com
To contact Margaret, use the Comments section below or @margaretyjy on Twitter


