CRUDE OIL PRICE OUTLOOK: SUPPORT TO FACE ANOTHER CRITICAL TEST
- Crude oil price action notches its steepest weekly decline since October 2020
- WTI pulls back -8% with shaky risk appetite helping drag the commodity lower
- The broader bullish trend could be in jeopardy as crude oil prints lower highs


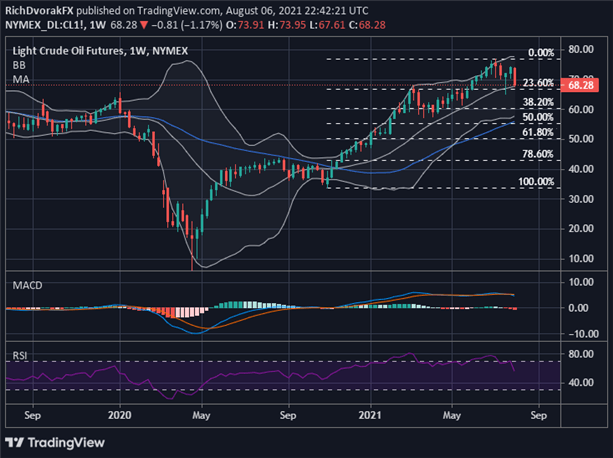
Crude oil prices faced heavy selling pressure this past week. The commodity dropped four out of the last five trading sessions and nearly -8% on balance, which marks the biggest weekly drop in nine months. Lingering concern about the delta variant of covid and evidence that economic growth is peaking stand out as primary drivers of the move. This leaves the broader bullish trend underpinning crude oil price action in jeopardy as lower highs start to form. Such has been expected given my downgrade to fundamental outlook for Q3.
CRUDE OIL PRICE CHART: WEEKLY TIME FRAME (JULY 2019 TO AUGUST 2021)

Chart by @RichDvorakFX created using TradingView
While the latest pullback does provide cause for concern, particularly in light of the MACD crossover and negative divergence on the relative strength index, crude oil bulls might find solace in nearside support that remains intact. The 20-week simple moving average and 23.6% Fibonacci retracement level of the November 2020 to July 2021 bullish leg roughly highlight this formidable zone of buoyancy. Failing to maintain altitude here at this critical area of support likely exposes oil price action to a larger correction that might send the commodity plunging into bear market territory.
Visit the DailyFX Education Center to learn more about technical analysis
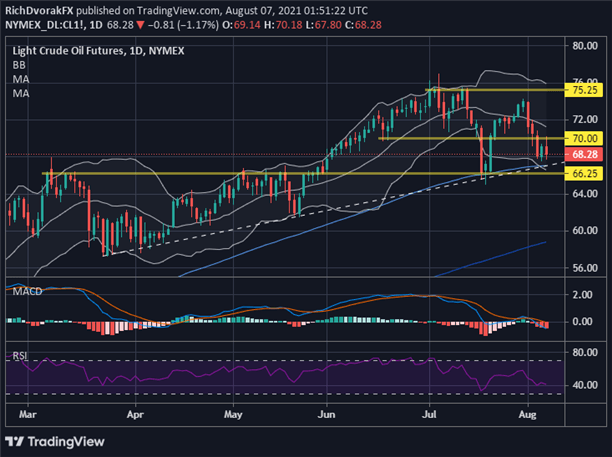
CRUDE OIL PRICE CHART: DAILY TIME FRAME (10 FEB TO 06 AUG 2021)

Chart by @RichDvorakFX created using TradingView
That said, how WTI crude oil opens and trades early on next week could be quite telling of the market’s directional bias. Holding the 100-day simple moving average will likely be key considering oil price action has not closed below this technical barrier since November 2020. The 66.25-price level and July swing lows stand out as the last lines of defense with potential to prevent bulls from capitulating. If crude oil bulls can stage another rebound off this support level, however, the 70.00-handle could come back into play.
| Change in | Longs | Shorts | OI |
| Daily | 0% | -10% | -3% |
| Weekly | 29% | -36% | 2% |
Reclaiming this psychological level might clear the way for the commodity to challenge its 20-day simple moving average again. A close above the 20-day simple moving average could see crude oil bulls take aim at the August open before eyeing resistance near the 75.25-price level and year-to-date highs. On the other hand, breaching the July swing low stands to invalidate the broader bullish trend developed over the last several months. That could motivate crude oil bears to set their sights on the 200-day simple moving average currently perched below $60.00/bbl.
-- Written by Rich Dvorak, Analyst for DailyFX.com
Connect with @RichDvorakFX on Twitter for real-time market insight


