


.jpg)

Euro, EUR/USD, Technical Forecast – Talking Points
- Long-term trendline from 2020 key to sustaining upside price action
- RSI Divergence and weakening MACD indicate potential weakness ahead
To read the full Euro forecast including the fundamental outlook, download our new 3Q trading guide from the DailyFX Free Trading Guides!

Long-term trendline enough to keep EUR/USD pacing higher as price grapples with the 200-day SMA?
The Euro performed well against the US Dollar through the first two months of the second quarter, although a bout of weakness hit the currency pair in June. Still, EUR/USD managed to find support at a long-term trendline stemming from the 2020 March swing low. Price may continue rising through the coming months should the rising support level hold.
That said, price may still be in danger of breaking lower, with a recent drop below the 200-day Simple Moving Average (SMA) being a cause for concern. Moreover, the Moving Average Convergence Divergence (MACD) oscillator is on pace to cross below its center line after dropping below the signal line, a bearish momentum signal.
EUR/USD Weekly Chart
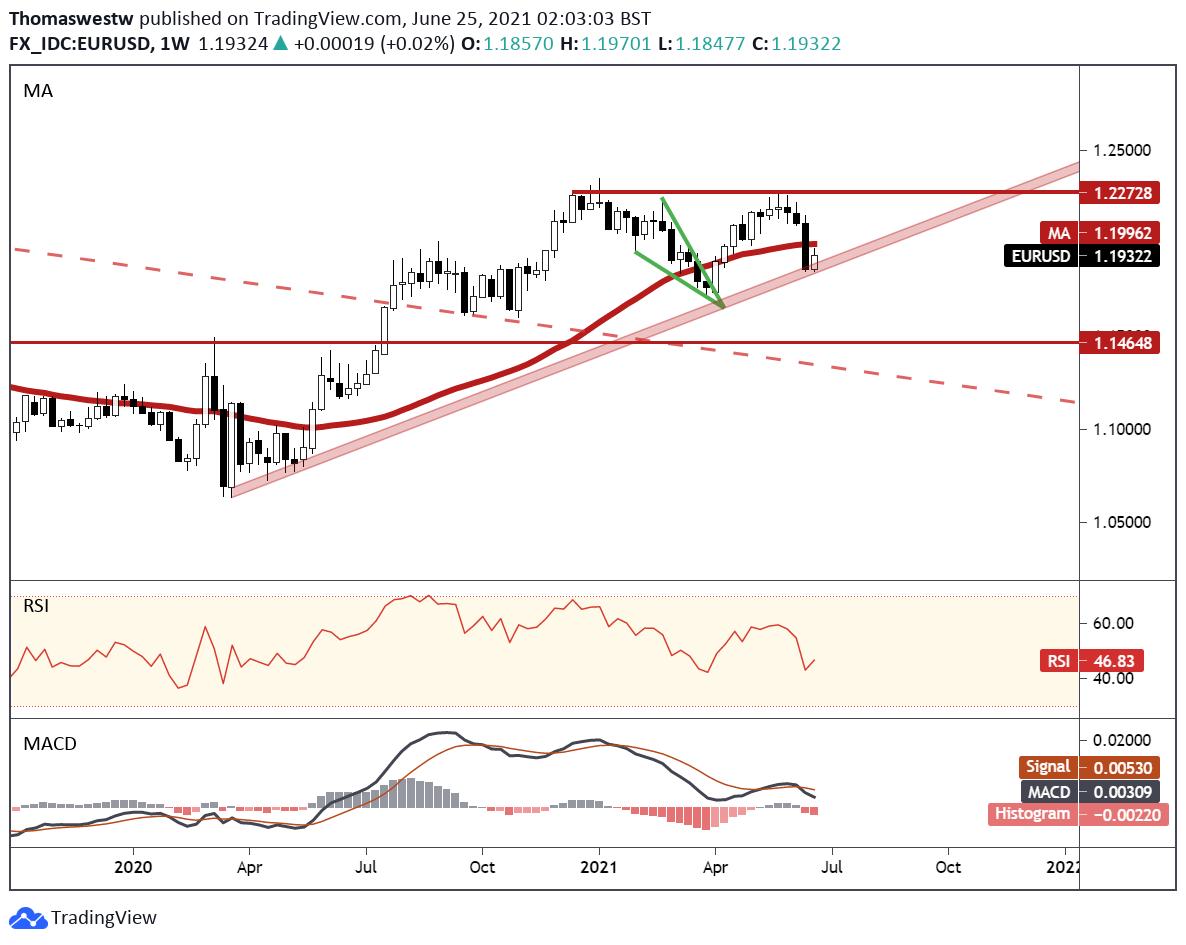
Chart created with TradingView
Pulling out to the monthly timeframe puts attention on the 78.6% Fibonacci retracement level (1.2211) from the January to March move where price stalled out after a two-month rally. Alternatively, the 38.2% and 23.6% Fib levels appear to be providing a level of support. A break to either side of the 78.6% or 23.6% Fibs could see an accelerated move.
One concern for Euro bulls is a negative divergence in the Relative Strength Index (RSI) between the January and May highs (as shown by the green line on the RSI indicator). Moreover, the MACD line is begging to shift lower towards its signal line, adding to the negative picture seen on the weekly timeframe above.
EUR/USD Monthly Chart

Chart created with TradingView
To read the full Euro forecast including the fundamental outlook, download our new 3Q trading guide from the DailyFX Free Trading Guides!
--- Written by Thomas Westwater, Analyst for DailyFX.com
To contact Thomas, use the comments section below or @FxWestwater on Twitter


