


Nasdaq 100, Nikkei 225, Hang Seng Index – Third Quarter Technical Forecast
- The Nasdaq 100 index breached above a key resistance, opening the door for higher highs
- The Nikkei 225 and Hang Seng Index may continue to range bound waiting for fresh catalysts
To read the full equity forecast, including the fundamental outlook, download our new 3Q trading guide from the DailyFX Free Trading Guides!

Nasdaq 100 Index
The Nasdaq 100 index breached above a key resistance level at 14,000 through the end of June, which opened the door for further upside potential. The index had also completed a “Double Bottom” patten as shown on the chart below, signalling a possible bullish trend reversal. The formation of consecutive higher highs and higher lows on the weekly chart underpins bullish momentum, paving the way for repeated attempts at fresh record highs. A major resistance level can be found at around 14,960 – the 261.8% Fibonacci extension.
Looking ahead, the upward trajectory remains intact for the US stock market, although some technical pullbacks are possible through the third quarter as the Fed’s monetary policy stance shifts towards a hawkish tone. The recent strong economic data, rising inflation and ample liquidity conditions may warrant a gradual scaling back of pandemic-era rescue efforts without causing a major pullback in equities.
The Nasdaq 100 index registered a massive gain of 30% over the past 8 months. On the weekly chart, the ascending trend shows no sign of stopping soon as the 4- and 10-week Simple Moving Average (SMA) lines are trending higher. Still, traders should be vigilant about short-term pullbacks if profit-taking kicks in.
Nasdaq 100 Index – Weekly Timeframe (2020 to 2021)

Source: TradingView
Nikkei 225 Index
The Nikkei 225 entered a consolidative period after failing to breach a 127.2% Fibonacci extension level (31,200) during March-April. The index attempted to break the ceiling of the channel following news that Japan eased State of Emergency measures in most prefectures. A successful breakout, if achieved, would likely intensify buying pressure and open the door for further gains towards 31,200.
That said, the 4-, 10- and 20-week SMA lines have recently formed a “Death Cross”, suggesting a bumpy road ahead for further recoveries. An immediate support level can be found around 28,360 – a 100% Fibonacci extension.
Looking ahead, current consolidation may pave the way for higher highs should a robust global economic recovery drive up demand for Japanese exports and services. On the other hand, a relatively strong Japanese currency may weigh on equity prices.
Nikkei 225 Chart – Weekly Timeframe (2019 to 2021)
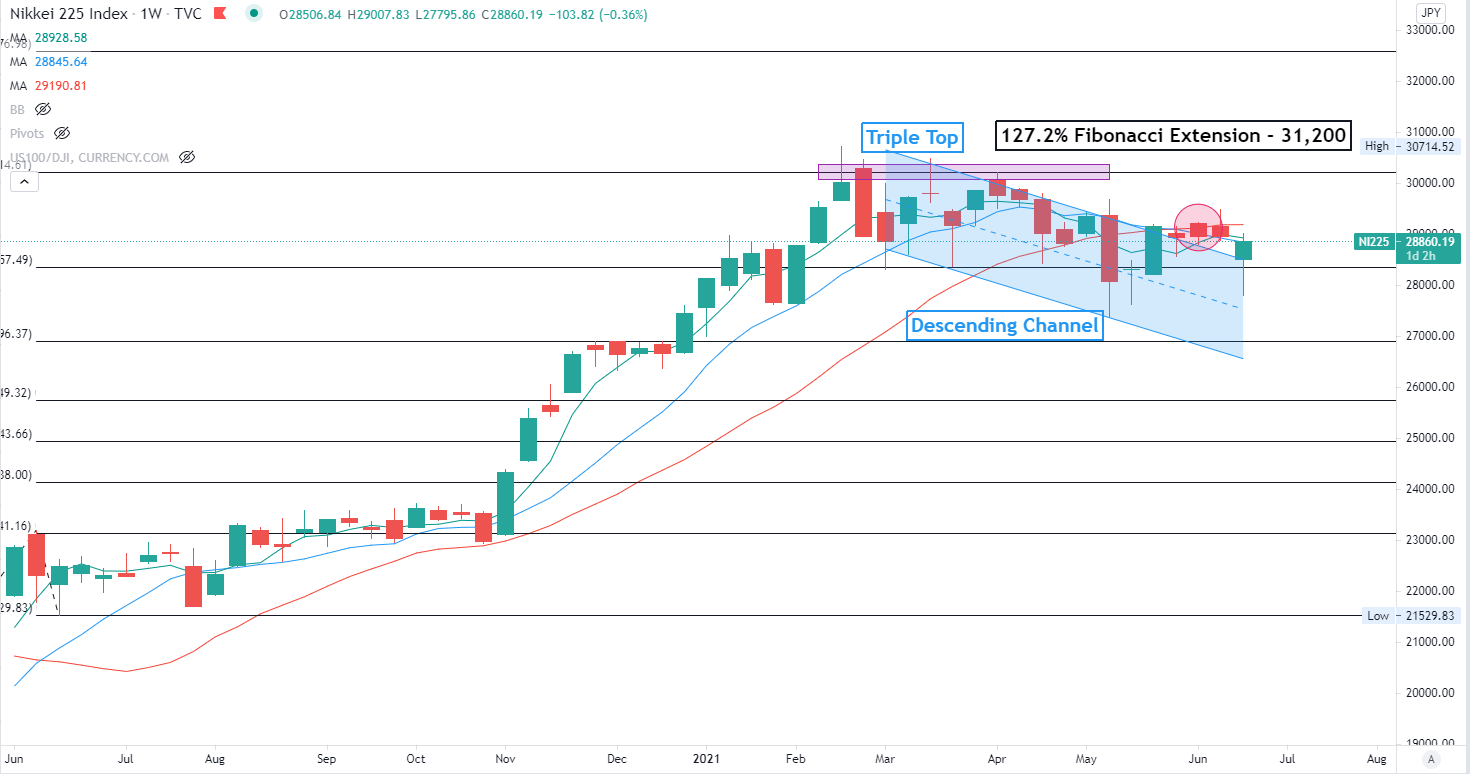
Source: TradingView
Hang Seng Index
Hong Kong’s Hang Seng Index (HSI) breached a major “Descending Channel” in early 2021 before prices entered a consolidative period. The index may continue to range between 28,100 and 29,300 waiting for fresh catalysts. A “Double Bottom” pattern has likely formed on the weekly chart, signalling that prices may have stabilized opening potential for a bullish trend reversal.
Looking ahead, a firm breach above the below 23.6% Fibonacci retracement (29,300) would likely intensify buying pressure and expose the next key resistance level at 31,180 – the previous high. However, a breakdown below support at 28,100 may lead to a deeper pullback with an eye on 27,150.
Hang Seng Index – Weekly Timeframe (2019 to 2021)

Source: TradingView
To read the full Equity forecast, including the fundamental outlook, download our new 3Q trading guide from the DailyFX Free Trading Guides!
--- Written by Margaret Yang, Strategist for DailyFX.com
To contact Daniel, use the comments section below or @ddubrovskyFX on Twitter


