


Technical Forecast for the Australian Dollar: Bearish
- Thanks to shifting fundamental forces – weaker commodity prices and a relatively less hawkish RBA – Aussie bears more control over price action across a number of AUD-crosses.
- Among the three AUD-crosses discussed in this report, AUD/NZD rates have the clearest bearish technical inclination.
- The IG Client Sentiment Index suggests that the AUD-crosses have bearish biases.

Australian Dollar Rates Week in Review
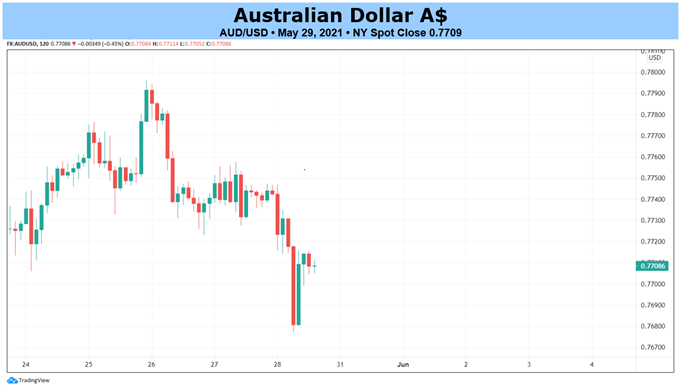
The last week of May proved mostly bearish for the Australian Dollar, with five AUD-crosses moving in favor of Australian Dollar weakness (AUD/CAD, AUD/NZD, AUD/USD, EUR/AUD, and GBP/AUD) and only two proving favorable for Aussie strength (AUD/CHF and AUD/JPY). Despite many global equity markets proving strong, the growing Australia-China trade war is proving damaging, with the latest casualties seemingly being industrial base metals (of which Australia is reliant on as its major export).
Declining commodity prices coupled with a Reserve Bank of Australia that is seemingly less hawkish than its commodity currency counterparts has set the stage for a weak start to June, where shifting narratives are beginning to give Aussie bears more control over price action across a number of AUD-crosses – and bulls are failing too.
AUD/USD RATE TECHNICAL ANALYSIS: DAILY CHART (March 2020 to May 2021) (CHART 1)
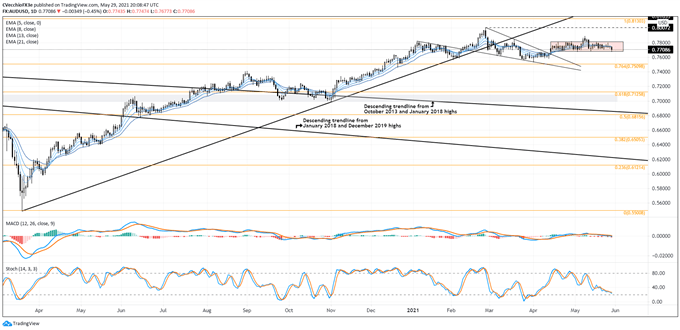
The last time we checked in on AUD/USD rates, it was noted that price action was forming into “a bull flag. Accordingly, the breakout at the end of the week suggests that the period of consolidation has ended, and the prior interpretation of price action coalescing into a bull flag indeed correct. To this end, AUD/USD rates are still in the throes of the aforementioned bullish falling wedge, which eyes a return to the yearly high at 0.8007.”
The problem: AUD/USD rates never found follow-through to the topside, rendering the prior observation incorrect. Failure to gain traction outside of the bull flag produced a reversal scenario, sending AUD/USD rates back to consolidation support (not a surprise after a false breakout). But if AUD/USD rates were to lose flag support, it would also suggest that the aforementioned bullish falling wedge is no longer the primary technical thrust.
AUD/USD rates are quickly losing momentum heading into June. The pair is below its daily 5-, 8-, 13-, and 21-EMA envelope, which is almost in bearish sequential order. Daily MACD has just started to slide below its signal line, while daily Slow Stochastics are creeping towards oversold territory. A deeper setback towards the 76.4% Fibonacci retracement of the 2020 high/low range at 0.7510 may begin soon.
IG Client Sentiment Index: AUD/USD RATE Forecast (May 28, 2021) (Chart 2)
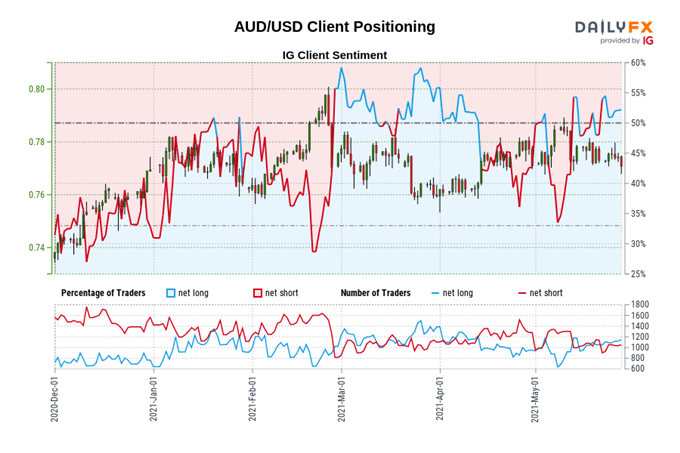
AUD/USD: Retail trader data shows 57.89% of traders are net-long with the ratio of traders long to short at 1.38 to 1. The number of traders net-long is 5.57% higher than yesterday and 17.33% higher from last week, while the number of traders net-short is 15.95% lower than yesterday and 9.68% lower from last week.
We typically take a contrarian view to crowd sentiment, and the fact traders are net-long suggests AUD/USD prices may continue to fall.
Traders are further net-long than yesterday and last week, and the combination of current sentiment and recent changes gives us a stronger AUD/USD-bearish contrarian trading bias.
AUD/JPY RATE TECHNICAL ANALYSIS: DAILY CHART (MARCH 2020 to May 2021) (CHART 3)
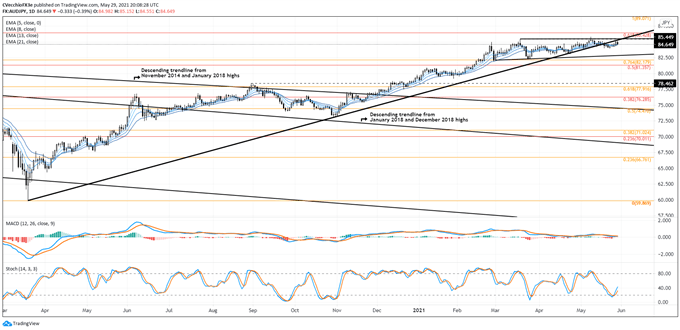
AUD/JPY rates may still be consolidating in an ascending triangle, but an important development has occurred: the pair has lost its uptrend from the March and November 2020 lows. AUD/JPY rates are hugging their daily EMA envelope following a rejection of the pandemic uptrend, suggesting that a shift in momentum may be beginning. Daily MACD is flat against its signal line, while daily Slow Stochastics are rising but still below their median line. Traders may want to watch lower timeframes (e.g. 4-hour, 6-hour) for technical evidence of topping patterns early in the week.
IG Client Sentiment Index: AUD/JPY Rate Forecast (May 28, 2021) (Chart 4)
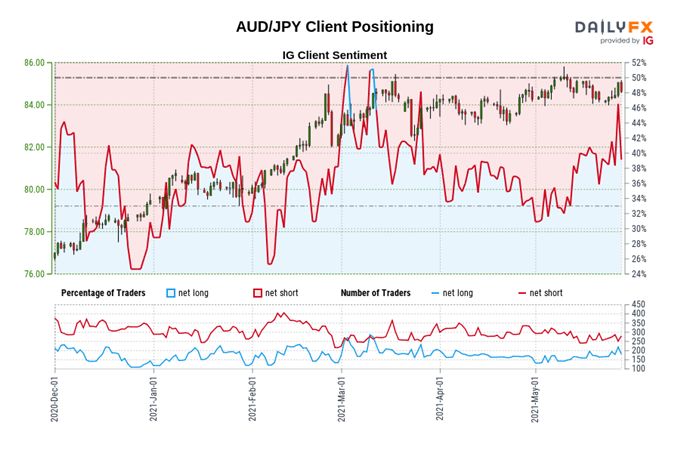
AUD/JPY: Retail trader data shows 40.71% of traders are net-long with the ratio of traders short to long at 1.46 to 1. The number of traders net-long is 6.56% lower than yesterday and 3.64% higher from last week, while the number of traders net-short is 9.78% lower than yesterday and 5.68% lower from last week.
We typically take a contrarian view to crowd sentiment, and the fact traders are net-short suggests AUD/JPY prices may continue to rise.
Yet traders are less net-short than yesterday and compared with last week. Recent changes in sentiment warn that the current AUD/JPY price trend may soon reverse lower despite the fact traders remain net-short.
AUD/NZD RATE TECHNICAL ANALYSIS: WEEKLY CHART (August 2017 to May 2021) (CHART 5)
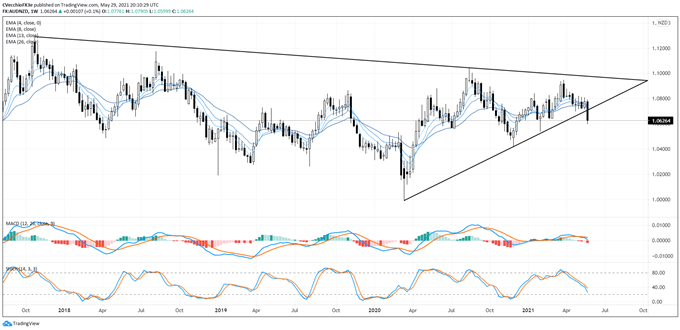
Among the three AUD-crosses discussed in this report, AUD/NZD rates have the clearest bearish technical inclination. The last full week of May produced a close below the rising trendline from the March and November 2020 lows, just a few weeks after establishing a lower high in 2021 relative to what was established in 2020. Combined with fundamental reasons to think that the RBA-RBNZ policy divergence has shifted in the Kiwi’s favor, AUD/NZD rates may now be in focus as a pair embarking on a longer-term decline.
Not only does the weekly chart show the critical bearish close, but it also highlights the acute shift in momentum to the downside recently. AUD/NZD rates are fully below their weekly 4-, 8-, 13-, and 26-EMA envelope, which is not yet in fully bearish sequential order. Weekly MACD is dropping towards its signal line, while weekly Slow Stochastics are accelerating towards oversold territory. AUD/NZD rates may be beginning a decline towards the late-2020 swing low near 1.0400.
CFTC COT Australian Dollar Futures Positioning (May 2020 to May 2021) (Chart 6)
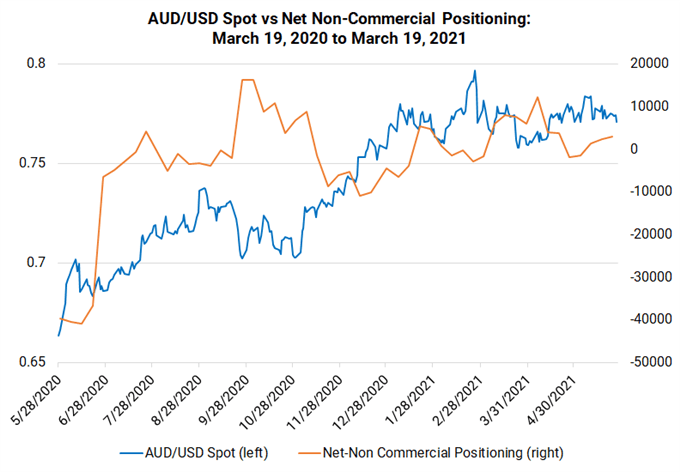
Finally, a consideration of positioning in the futures market. According to the CFTC’s COT for the week ended May 25, speculators slightly increased their net-long Australian Dollar positioning to 3,002 contracts, up from the 2,416 net-long contracts held in the week prior. Positioning in the futures market remains rather benign, providing plenty of slack for the Australian Dollar to embark on a new trend without risk of ‘overcrowding’ in the short-term.

--- Written by Christopher Vecchio, CFA, Senior Currency Strategist


