


GBPUSD, EURGBP, GBPJPY and GBPAUD Technical Forecast Talking Points:
- GBPUSD is just below the midpoint of the range carved out over the previous 7 years with the smallest 8-day range since June 2019
- A Sterling break seems a high probability in the proximate future (next few weeks) but broader market conditions will dictate timing
- Among the Pound crosses, GBPJPY stands out as it ended this past week with a charge to a 5-year range high

Technical Forecast for British Pound: Bearish
There are plenty of markets with impressive technicals to draw upon, but few have the same density of consequential resistance and support as the British Pound crosses. However, the presence of these patterns and barriers does not ensure a critical break – much less follow through. The critical consideration in this technical potential is market conditions such as liquidity and the broader market’s propensity to forge trends. We seem to have found a sharp decline in liquidity heading into the extended US/UK holiday weekend, but I wouldn’t expect markets to simply be down through the remainder of the ‘Summer doldrums’. A pair with truly appealing near and long-term potential is GBPUSD (‘cable’). The past 8-days of trading which have represents consolidation below 1.4200 represents the smallest historical range over that period as a percentage of spot since June 2019. In other words, a break is probable. The question is what direction it takes. It is certainly possible for a bullish resolution as that is the prevailing trend, but overhead is the 50 percent Fib of the readily registered range from 2014 to 2020 at 1.4300. The ‘path of least resistance’ is lower which runs into a pivot level at 1.40 and then the trend-defining 100-day moving average around 1.3900. If markets don’t shift back into high gear for trend development, I believe a bearish resolution is more likely to find follow through.
Chart of GBPUSD with 100-Day Moving Average, 8-Day Range and ATR (Daily)

Chart created with the TradingView Charting Platform
Looking to the world’s second most liquid Pound-based cross, EURGBP is finding itself near the floor of a range that has developed over the past three months. Support is not decisive but seems to fall in the 0.8585/8570 area. When you have this kind of picture, it is best to look for confirmation of a break rather than seeing a intraday clearance which can quickly turn into a false breakout. This is one cross where the Sterling’s progress over the past year has not been impressively consistent (like GBPUSD). Ultimately, this pair will start the new trading week in exactly the middle of its more substantial range of 0.8700 to 0.8500. Range trading in this spans is the most likely tempo for the week ahead.
Chart of EURGBP with 100-Day Moving Average (Daily)
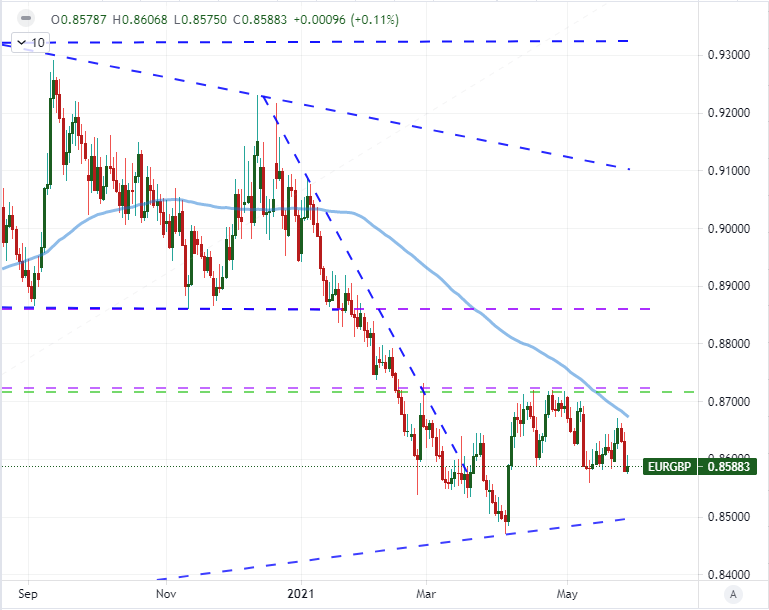
Chart created with the TradingView Charting Platform
An interesting cross a little further off the beaten path is GBPCAD. The Canadian Dollar has been a particularly strong major in its own right with USDCAD pacing one of the most remarkable trends in the FX market these past few months. This makes for competing strength between the Sterling and Loonie. Ultimately, we are left with a congestion on the pairing and impressively a consolidation that has turned into an inverse head-and-shoulders pattern. The right shoulder is an ascending wedge with resistance (the ‘neckline’) at 1.7165. If there is progress for the Sterling going forward, this is a lower boundary break for bulls compared to GBPUSD where conviction would need to be far deeper.
Chart of GBPCAD and 150-Period Moving Average (8 Hour)
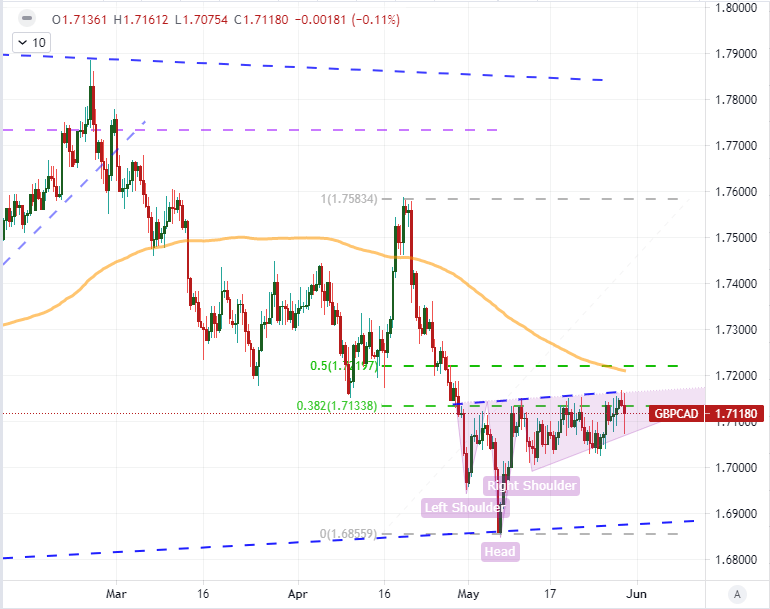
Chart created with the TradingView Charting Platform
Since we have closed out a trading month, I think it is worth looking at a Pound cross from a monthly chart. There is no more impressive layout on this time frame than from GBPJPY. With a broad Yen cross rally through the end of this past week, we have seen this pair in particular rally up to the test the highs set back in February 2018. That also happens to fall at the midpoint of the 2011 to 2015 rally (when the Bank of Japan was aggressively attempting to devalue the local currency). This is a pair driven as much by ‘risk trends’ as by the Sterling, but serious conviction needs to be found to muster a break that has an eye to carrying forward.
Chart of GBPJPY with 100-Month Moving Average (Monthly)

Chart created with the TradingView Charting Platform
For Pound positioning, large speculative futures traders are holding a meaningful net long exposure. We are still below the peak from this past March, but nevertheless in a zone that has historically coincided with incidental tops. Bullish interest could always be pushed to greater extremes (just see the bearish position back in 2019 as it hit subsequent lows) so these traders are waiting to see next steps from congestion just like us.
Chart of GBPUSD and CFTC’s Pound Futures Net Speculative Positioning (Weekly)
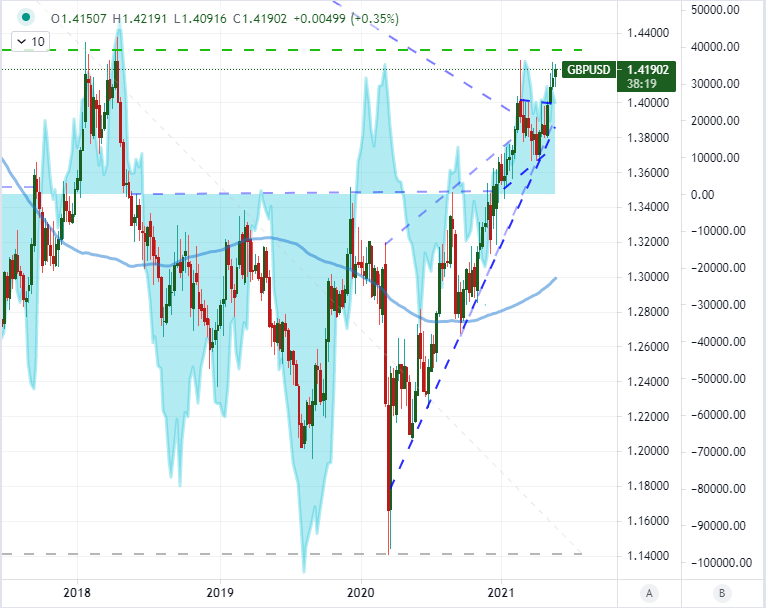
Chart created with the TradingView Charting Platform
Speaking of ‘us’, retail traders are definitely leaning into the range scenario. Net positioning from IG shows retail FX traders has pushed bearish interest to levels commensurate with late February while bullish exposure is as low as its been in 2021. The net leaves us at approximately 70% net short which is the extreme from the frequent range trading this category has pursued over the past year.
Learn more about how to incorporate sentiment measures into your trading strategy.
| Change in | Longs | Shorts | OI |
| Daily | 2% | 1% | 1% |
| Weekly | -11% | 26% | 1% |
Chart of GBPUSD and Retail Trader Positioning from IG Clients (Daily)
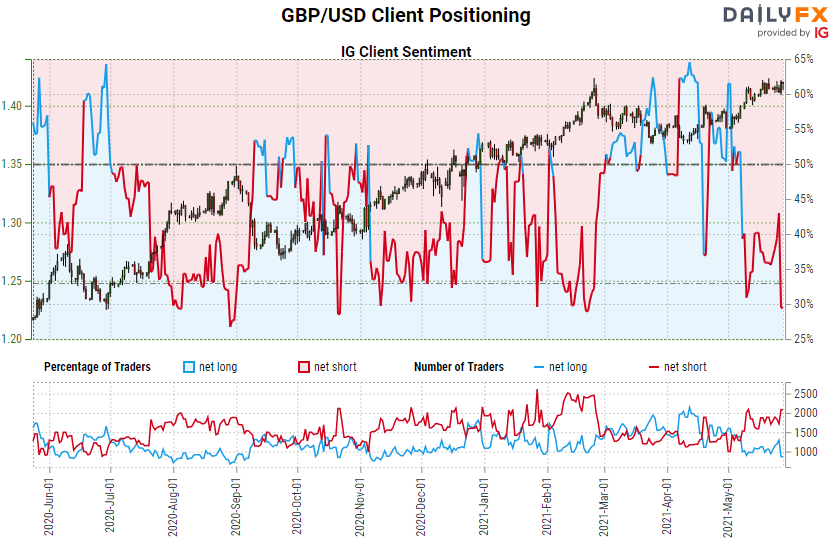
Chart from DailyFX.com


