


Nasdaq 100, DAX 30, FTSE 100 Forecasts: Mixed
- The Nasdaq 100 rests above nearby support and an important ascending trendline from September
- The DAX 30 teeters near recent highs with record levels in its sights
- The FTSE 100 is at risk of breaking beneath a rising wedge that would see losses accelerate

Nasdaq 100 Technical Forecast
Outlook: Bullish
The Nasdaq 100 endured considerable volatility last week as risk assets ranging from technology stocks to cryptocurrencies bounced between support and resistance with ease. In the case of the Nasdaq 100, a late-week surge saw the index retake an influential area around 13,400 and, perhaps more importantly, move off an ascending trendline from September. In the week ahead, the tech-heavy index will look to utilize both areas as support should selling pressure return.
Nasdaq 100 Price Chart: 4 - Hour Time Frame (September 2020 – May 2021)
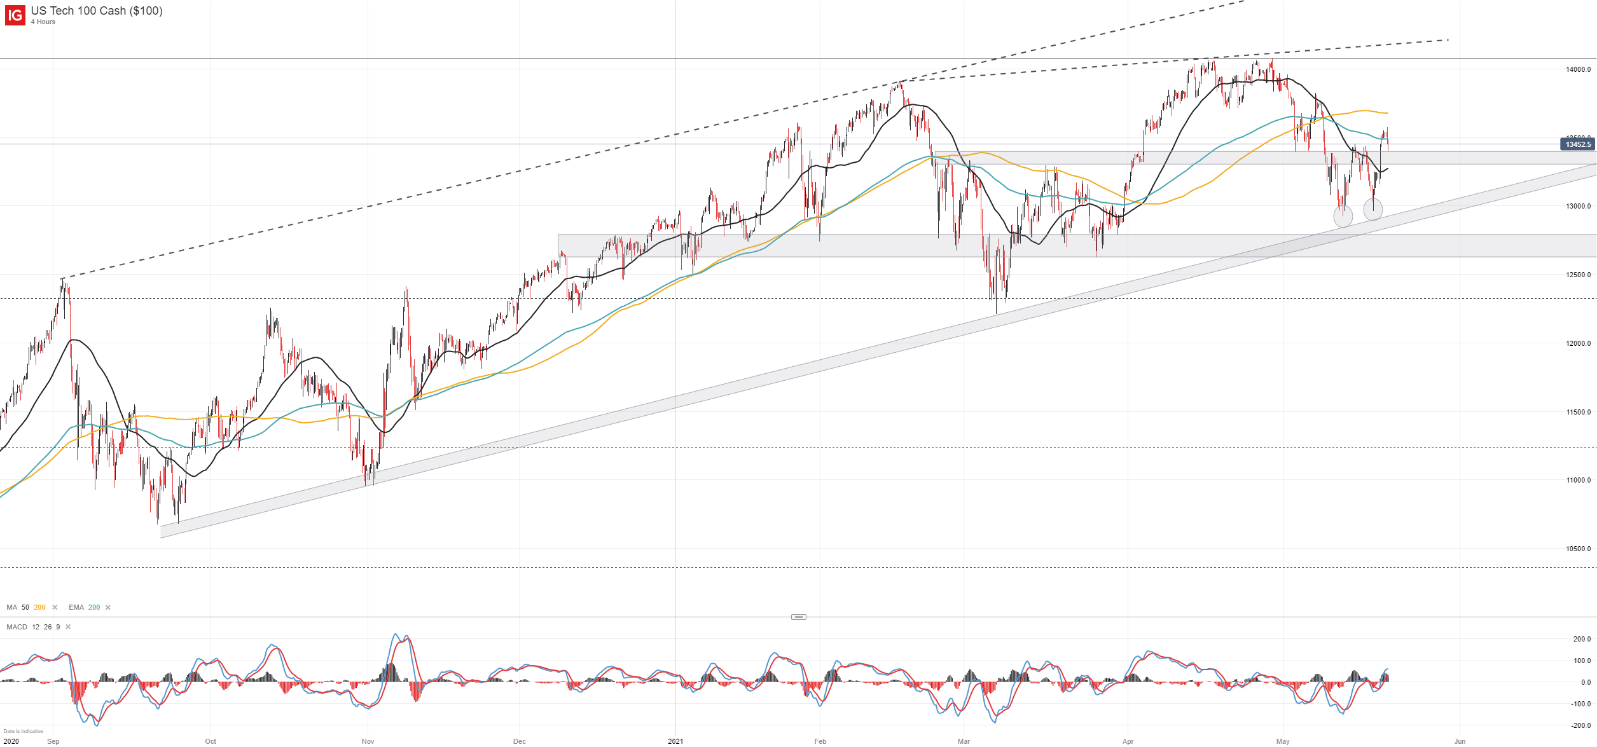
With that in mind, the Nasdaq 100 continues to possess the least encouraging technical landscape of the three major US indices. The index is now well beneath its March 2020 uptrend. Nevertheless, recent price action has led to the development of a potential double-bottom formation near the rising trendline from September and the index remains above its 200-day simple moving average.
The Trend is Your Friend: Forex Trendlines
Thus, while the Nasdaq 100 chart is not one of picture-perfect health, there is an argument to be made that a shorter-term bottom has been placed and the index might continue higher in the week ahead and look to approach recent swing highs. Any break beneath the rising trendline from September would seriously damage the technical outlook and would open the door to a deeper downswing.
DAX 30 Technical Forecast
Outlook: Neutral
The DAX 30 tracked broader risk trends last week, as it usually does, but remains on the brink of record levels even as the US indices shy away from new highs – an encouraging sign for the German equity index to be sure. The index enters this week in a band of resistance around the 15,450 area, a zone that has worked to stall prior attempts higher and could prove troublesome yet again.
DAX 30 Price Chart: 4 - Hour Time Frame (February 2021 – May 2021)
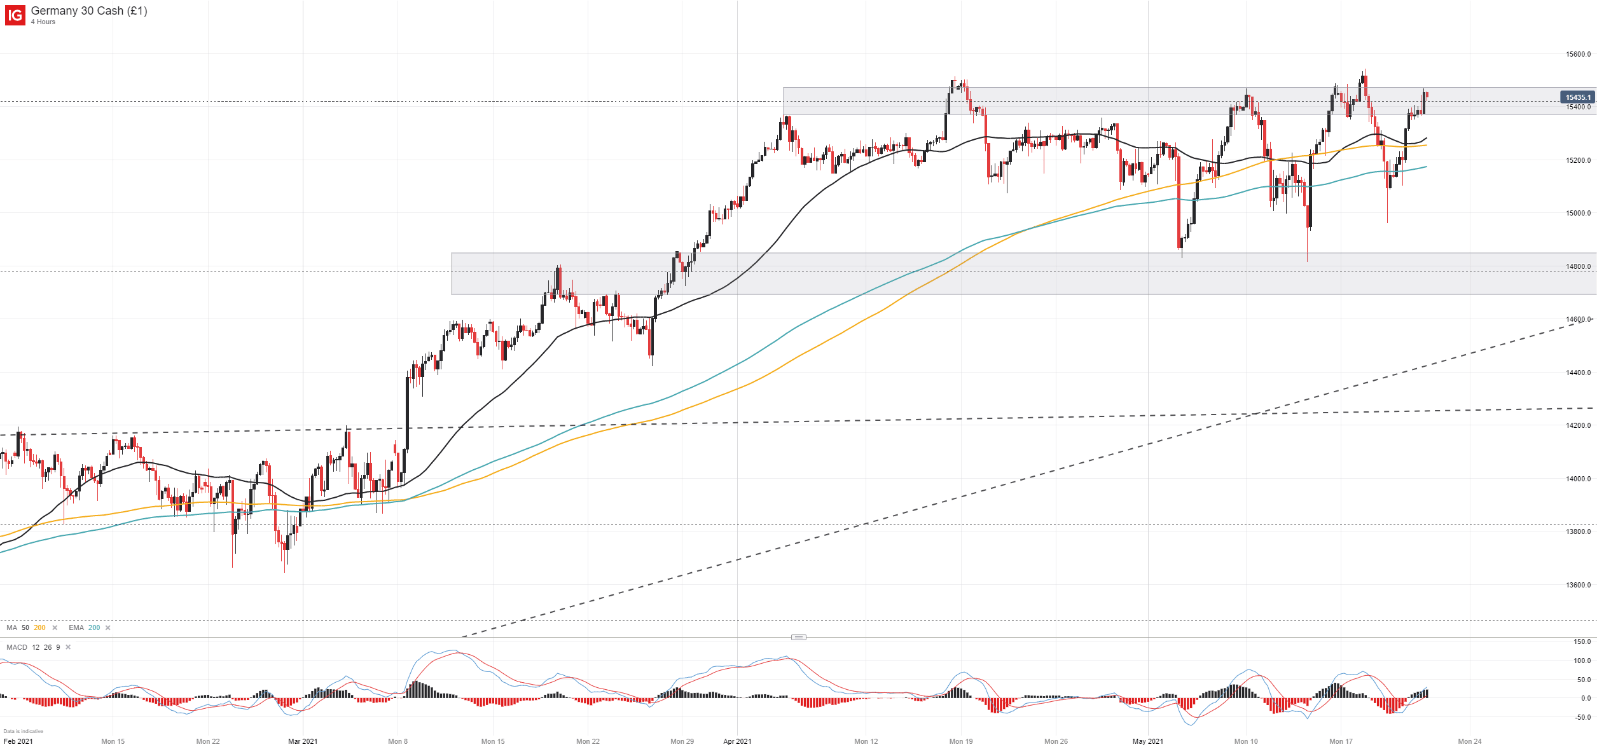
Regardless, the DAX 30 enjoys an upbeat outlook over the longer-term but may appeal to range traders in the days ahead if another failed breakout is posted. Until the range is broken with confidence and a follow-through, the DAX 30 may be confined to trade between 15,450 and 14,000 with a bias toward the topside.

FTSE 100Technical Forecast
Outlook: Bearish
The FTSE 100 is in somewhat of a range of its own as it teeters on the lower bound of a rising wedge formation. The pattern has helped guide the index higher since January but is at risk of breaking down after a few bearish probes broke beneath the lower trendline in May. Thankfully for bulls, the index’s 50-day simple moving average coincides perfectly with the trendline giving the area an added kick that may have helped keep the formation intact last week.
FTSE 100 Price Chart: Daily Time Frame (January 2020 – May 2021)
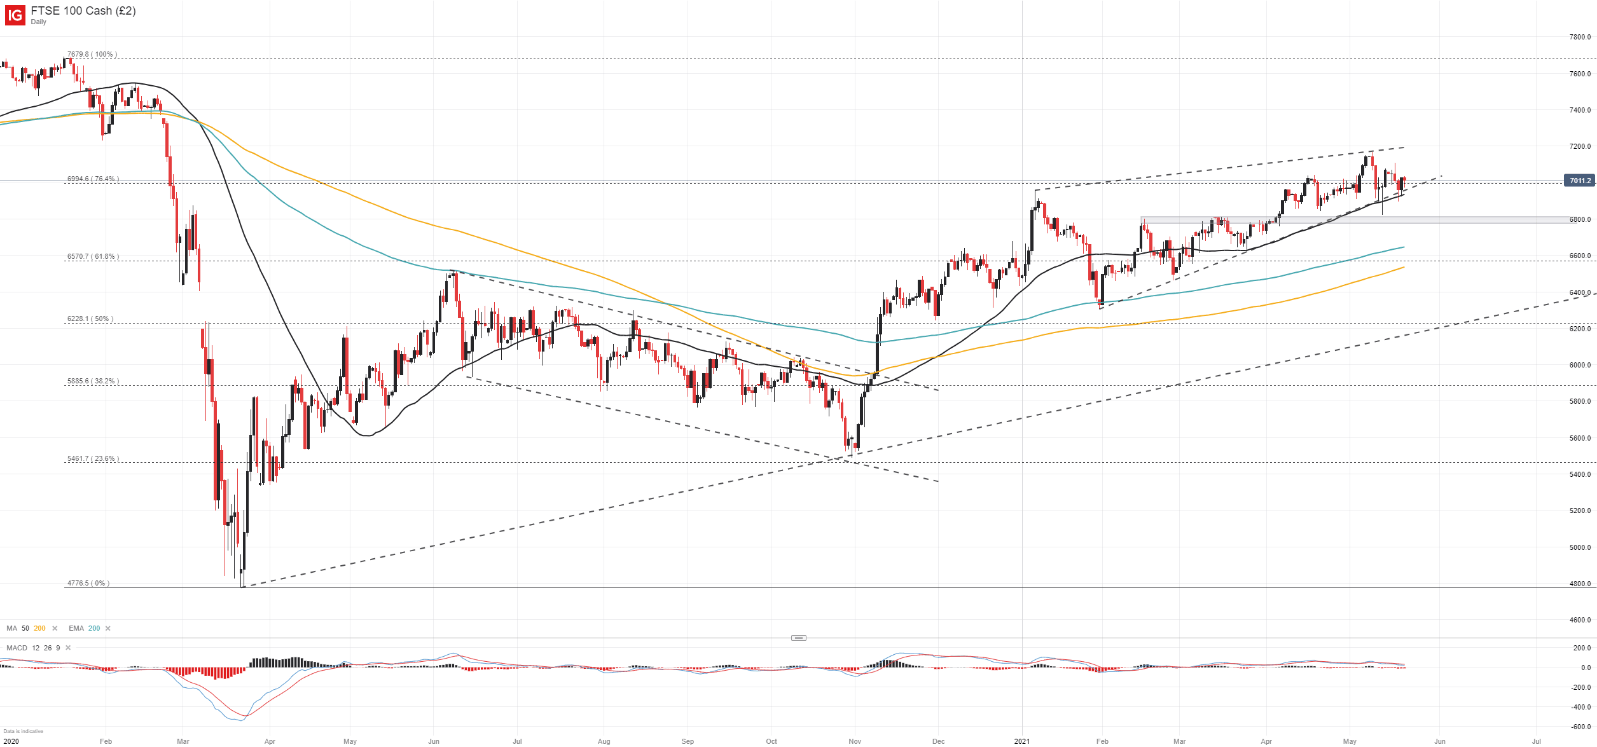
While price remains within the wedge for now, cracks have begun to show and the FTSE 100 could slip lower and seek support around 6,800. To the topside, resistance is rather sparse until the upper bound and recent highs come into play just shy of 7,200.

In terms of trading setups, the current FTSE 100 landscape is not ideal for risk-reward profiles. That said, short exposure – with a tight stop - is slightly preferable in my opinion as a break could see losses accelerate. In the meantime, follow @PeterHanksFX on Twitter for updates and analysis.
--Written by Peter Hanks,Strategist for DailyFX.com


