


Crude Oil Technical Forecast: Mixed
- A period of consolidation appears ahead for crude oil prices.
- Descending Triangle pattern may cap upside in the near term.

Crude oil prices have drifted lower in recent days, after bursting back above the psychologically imposing $60 per barrel level. Although the long-term technical outlook points to further gains, prices may consolidate in a relatively tight range in the near term.
Crude Oil Weekly Chart – Break of 2008 Downtrend Points to Further Upside

Chart prepared by Daniel Moss, created with Tradingview
The longer-term technical outlook for crude oil remains biased to the upside, as prices remain constructively positioned above all six moving averages and the downtrend extending from the 2008 high.
However, with a bearish crossover taking place on the MACD indicator, and the RSI testing its uptrend extending from the March nadir, an elongate period of consolidating could be at hand.
That being said, if support at 58.90 continues to hold firm, a retest of the yearly high (67.94) probably takes place in the coming weeks.
On the other hand, if sellers successfully breach support, a pullback to the sentiment-defining 144-EMA (51.92) may be in the offing.
Crude Oil Daily Chart – Consolidating in Descending Triangle
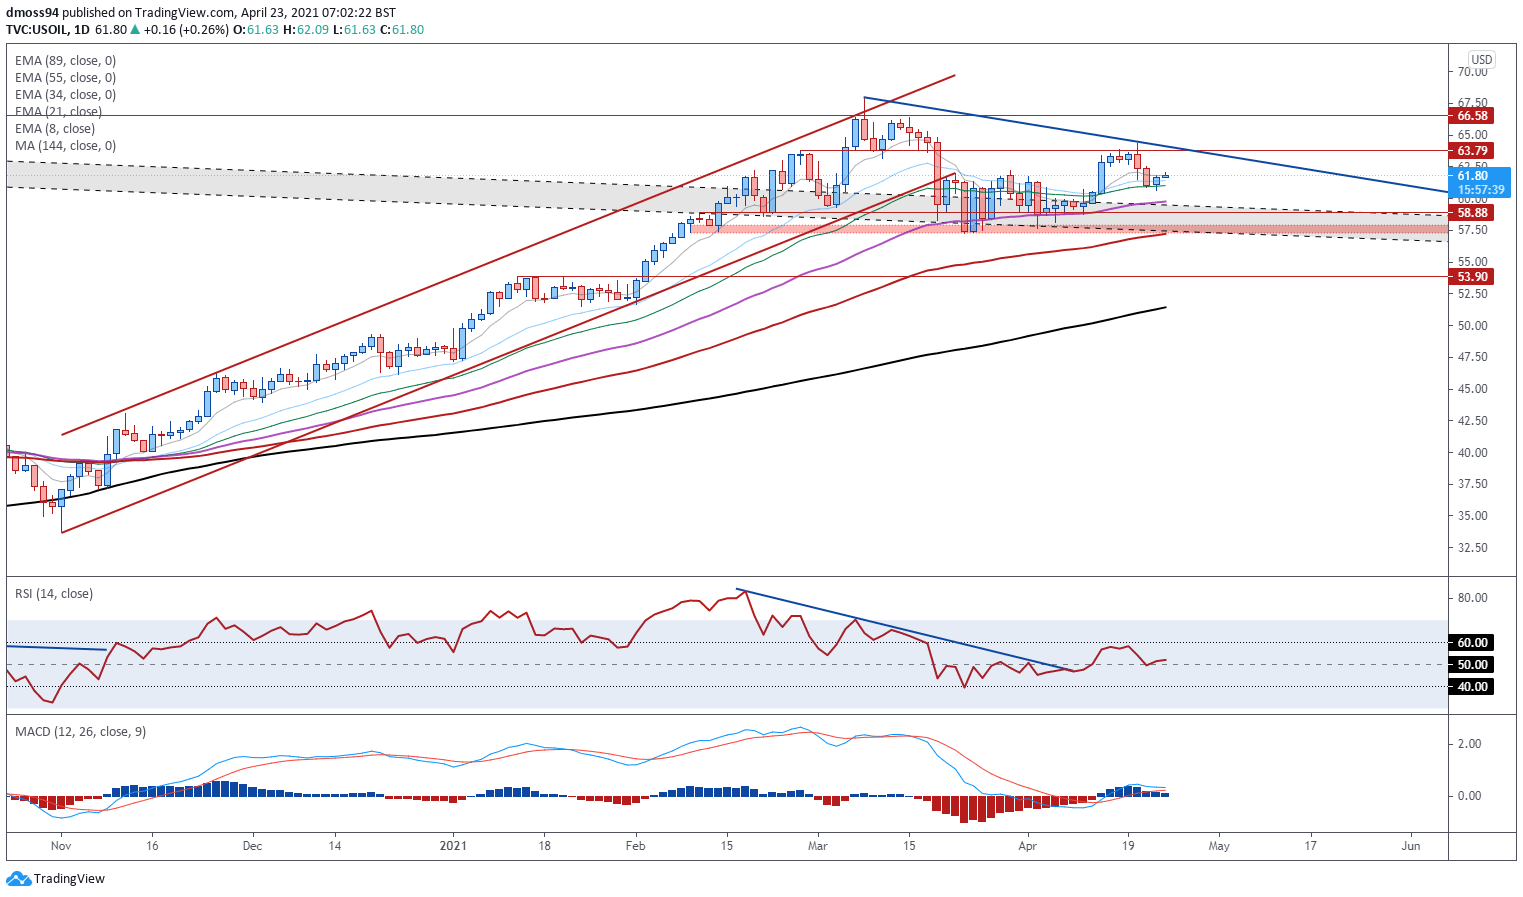
Chart prepared by Daniel Moss, created with Tradingview
Zooming into the daily chart also suggests that prices may continue to consolidate over the near term, with the formation of a Descending Triangle possibly taking shape.
Nevertheless, bullish moving average stacking, in tandem with both the RSI and MACD tracking firmly above their respective neutral midpoints, suggests that the path of least resistance is higher.
Ultimately, a daily close above 63.80 is needed to validate bullish potential and bring the yearly high (67.94) into focus. Hurdling that would signal the resumption of the primary uptrend and carve a path for buyers to challenge psychological resistance at 70.00.
However, if Descending Triangle resistance holds firm, prices may continue to grind back towards range support at 57.30 – 57.90.

The IG Client Sentiment Report shows 62.74% of traders are net-long with the ratio of traders long to short at 1.68 to 1. The number of traders net-long is 5.44% lower than yesterday and 7.43% higher from last week, while the number of traders net-short is 10.59% higher than yesterday and 29.45% lower from last week.
We typically take a contrarian view to crowd sentiment, and the fact traders are net-long suggests Oil - US Crude prices may continue to fall.
Positioning is less net-long than yesterday but more net-long from last week. The combination of current sentiment and recent changes gives us a further mixed Oil - US Crude trading bias.
-- Written by Daniel Moss, Analyst for DailyFX
Follow me on Twitter @DanielGMoss


