


British Pound Technical Forecast: Mixed
- The British Pound has had a stellar start to 2021 against its major counterparts.
- However, fading momentum could signal a period of consolidation for GBP/JPY and GBP/USD rates.
- Meanwhile, EUR/GBP may extend its slide towards the 2020 low.

The British Pound has accelerated higher against its major counterparts in the first quarter of 2021, as markets priced in a faster-than-expected return to normality on the back of a highly-successful vaccination distribution program and the diminishing possibility of further monetary policy easing by the Bank of England.
From a technical level, although the long-term outlook for the Pound Sterling remains overtly bullish against the haven-associated Japanese Yen and US Dollar, fading upside momentum could trigger a period of consolidation. While GBP may continue to gain ground against EUR in the near term. Here are the key levels to watch for GBP/USD, GBP/JPY and EUR/GBP rates.
GBP/USD Weekly Chart – Fading Momentum Could Lead to Period of Consolidation
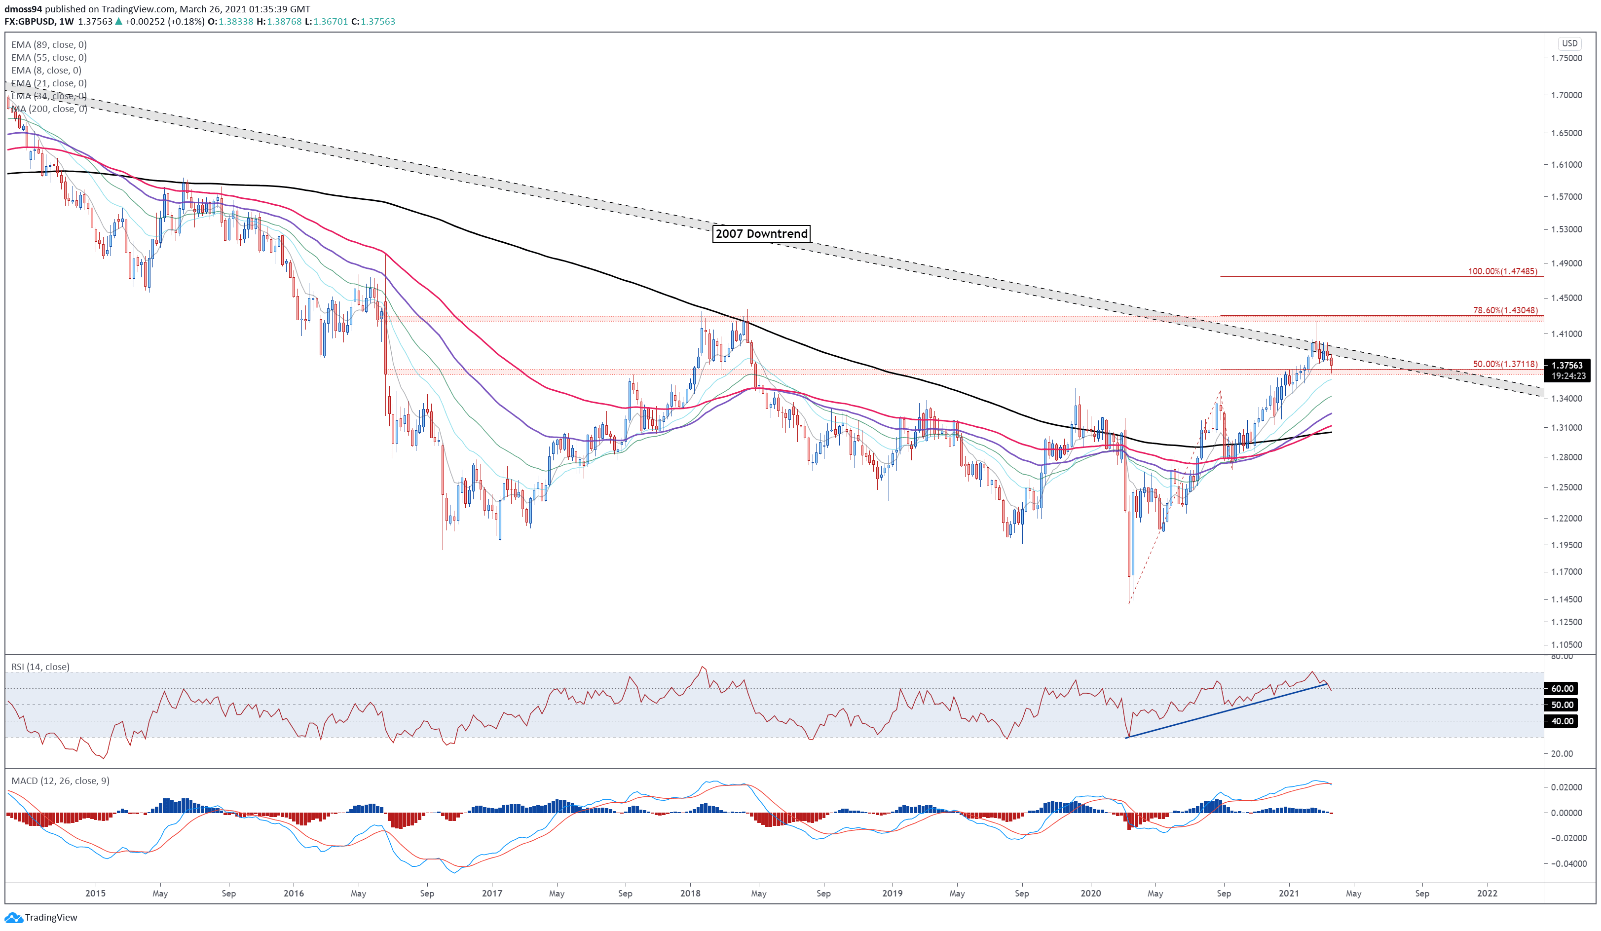
GBP/USD weekly chart created using Tradingview
GBP/USD rates have stormed higher in 2020, climbing over 4.4% to multi-year highs at the tail-end of February. However, price has since drifted back towards former resistance-turned-support at the 50% Fibonacci (1.3172), after failing to successfully breach the downtrend extending from the 2007 highs.
Bullish momentum seems to have subsided as of late, with a bearish crossover taking place on the MACD indicator, and the RSI snapping its 12-month uptrend and diving back below 60 for the first time this year. This could foreshadow a period of consolidation above range support at 1.3660 – 1.3710.
If this area remains intact, a future run at the 1.4000 mark looks likely in the near term, with a daily close above this psychologically imposing resistance level needed to validate the break of the 2007 downtrend and bring the 78.6% Fibonacci (1.4305) back into the crosshairs.
Alternatively, if selling pressure drives price below 1.3660, a test of mobile support at the 34-EMA (1.3428) may be on the cards.
| Change in | Longs | Shorts | OI |
| Daily | -4% | -11% | -6% |
| Weekly | 9% | -17% | -1% |
GBP/JPY Weekly Chart – Descending Triangle Break Hints at Further Gains
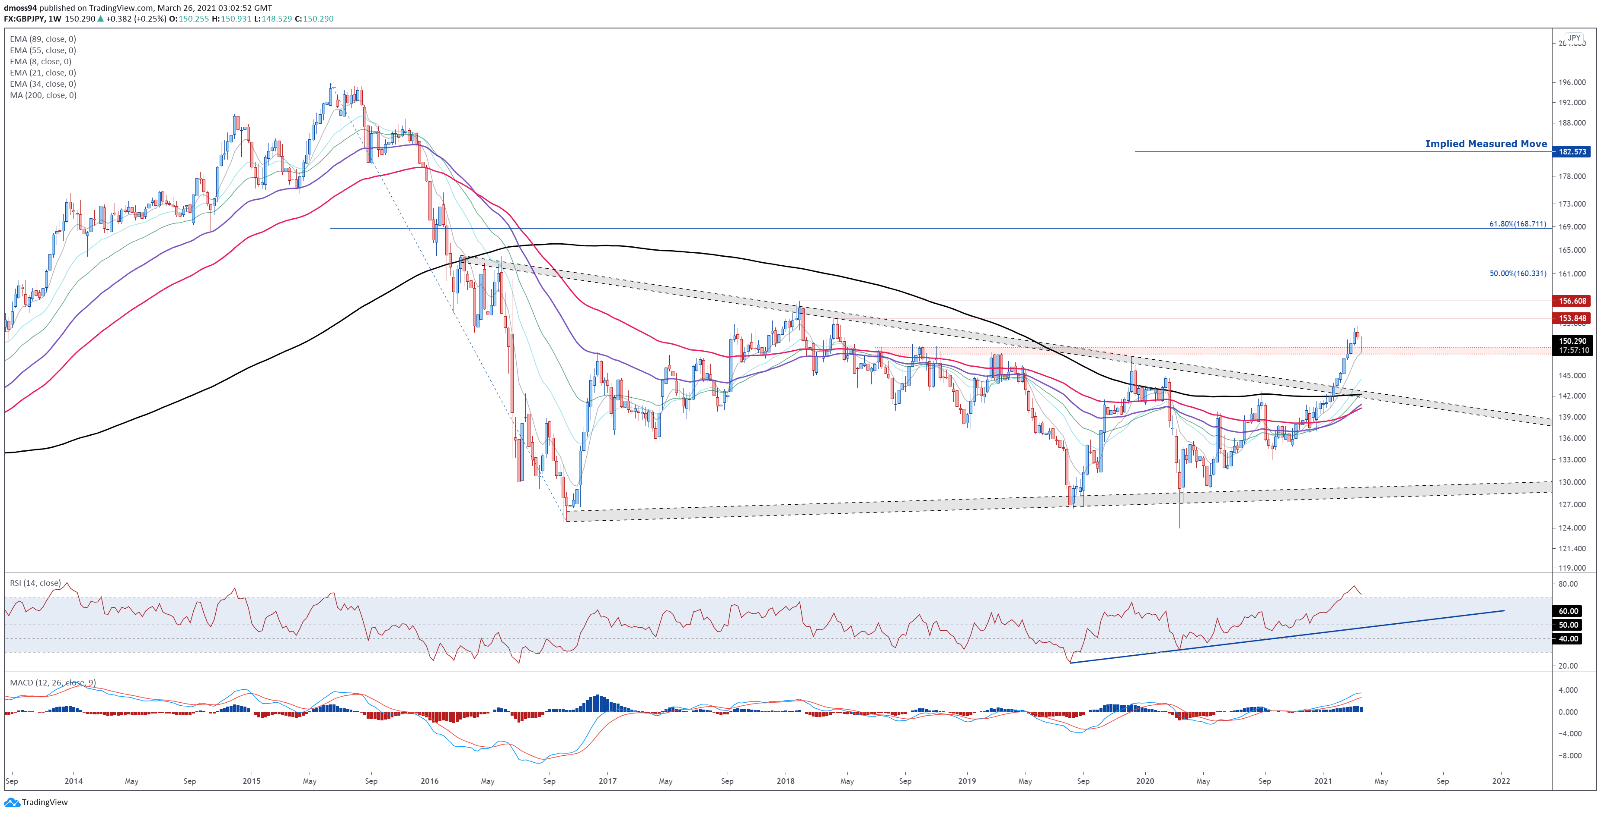
GBP/JPY weekly chart created using Tradingview
After notching a string of 9 consecutive weeks of gains, the GBP/JPY exchange rate may pause for breath over the coming weeks in attempt to work off the most extreme overbought RSI readings since 2014.
That being said, with price convincingly validating the break of a 4-year Symmetrical Triangle pattern, and both the MACD and RSI tracking firmly in bullish territory, a more extended topside push seems likely in the months ahead.
Remaining constructively positioned above the 8-week EMA (148.51) and 149.00 handle would probably open the door for the exchange rate to resume its climb higher. A weekly close above the March high (152.55) likely precipitating a challenge of the 2018 high (156.61).
While over the longer-term, the Symmetrical Triangle pattern’s implied measured move suggests GBP/JPY could gain as much as 21.5% from current levels to probe 182.00.
On the contrary, a weekly lose below 148.50 could facilitate a short term pullback to the February 2020 high (144.96) however, given the flurry of bullish signals a deep correction seems unlikely at this stage.
| Change in | Longs | Shorts | OI |
| Daily | -27% | -1% | -8% |
| Weekly | -34% | 0% | -9% |
EUR/GBP Weekly Chart – Ascending Triangle Breach Points to Extended Losses
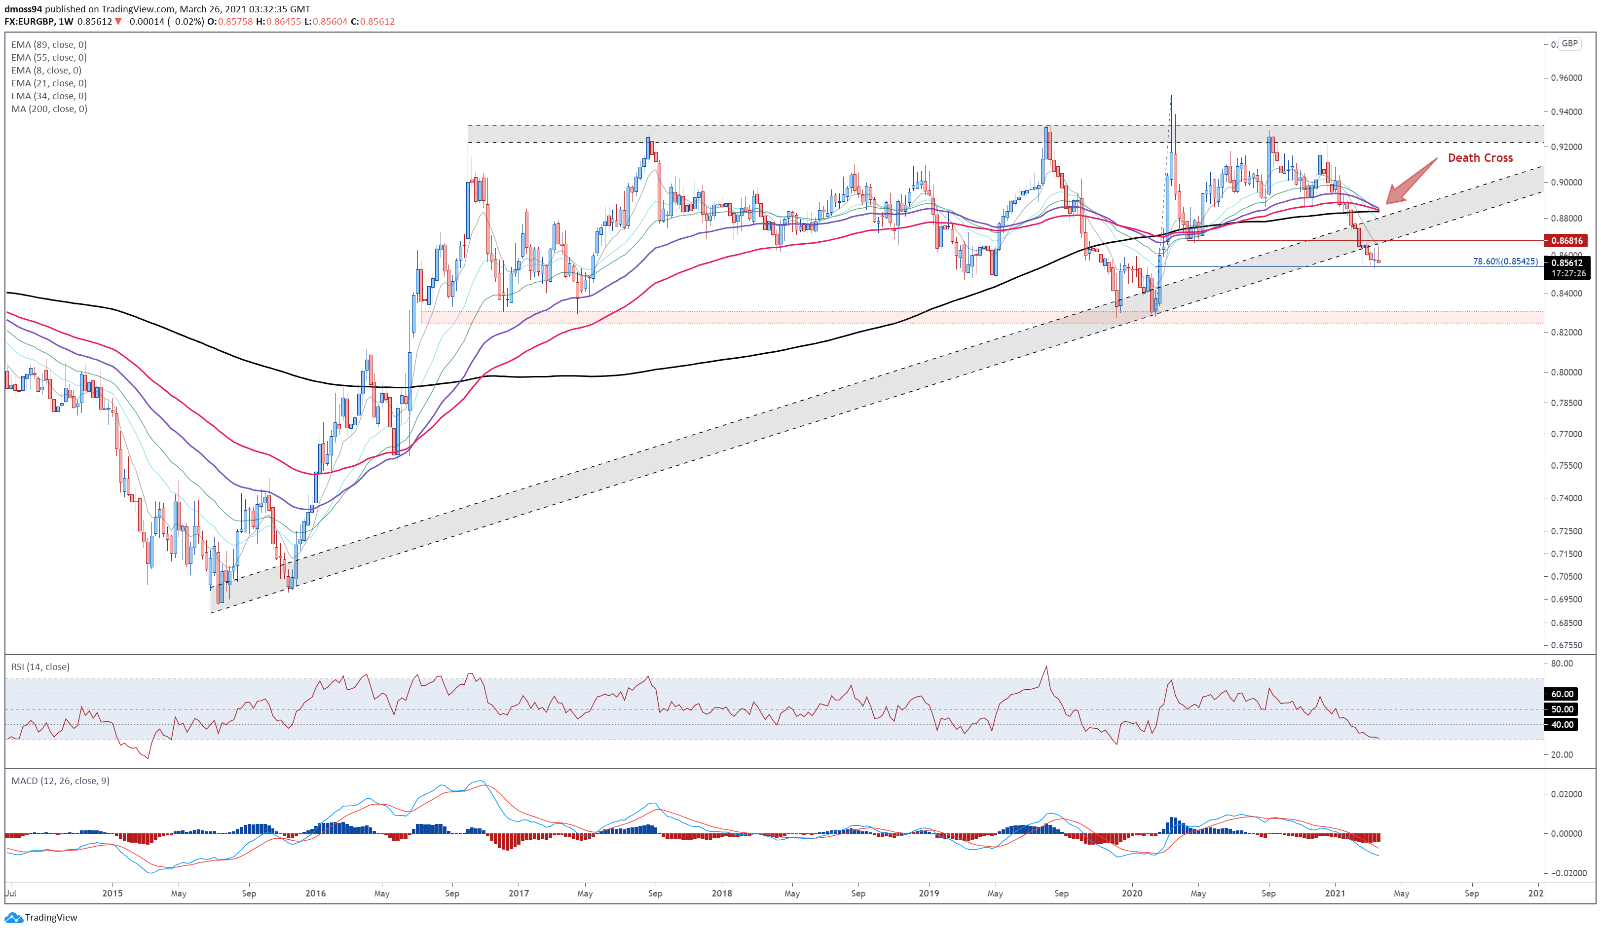
EUR/GBP weekly chart created using Tradingview
A series of bearish technical indications spells trouble for EUR/GBP bulls over the medium-to-long term, as the exchange rate collapses below the 0.8600 handle and breaches the hypotenuse of an Ascending Triangle formation.
With the MACD falling to its most extreme levels late-2019, and the RSI eyeing a push into oversold territory, the path of least resistance seems heavily skewed to the downside.
Piercing support at the 78.6% Fibonacci retracement of the 2020 range would likely intensify selling pressure and carve a path for the exchange rate to challenge last year’s low (0.8282).
However, a short-term rebound towards former support-turned-resistance at 0.8680 can’t be ruled out, if bears are unable to hurdle Fibonacci support.
| Change in | Longs | Shorts | OI |
| Daily | 11% | -6% | 4% |
| Weekly | -8% | 10% | -2% |
-- Written by Daniel Moss, Analyst for DailyFX
Follow me on Twitter @DanielGMoss


