


AUSTRALIAN DOLLAR WEEKLY TECHNICAL FORECAST – NEUTRAL
- AUD/USD price action could be developing an ascending triangle pattern as higher lows form
- AUD/JPY oscillates near 37-month highs though Australian Dollar strength has started waning
- AUD/NZD struggles to surmount the 61.8% Fibonacci retracement level of its 2020 bearish leg
- Check out our Education Center for insight that can help improve your technical analysis !
The Australian Dollar has traded largely mixed against key FX peers like the US Dollar, Yen, and New Zealand Dollar over recent trading sessions. AUD/USD price action finished flat last week after whipsawing around the Fed update. AUD/JPY was also little changed as the Aussie closed out the week on its back foot after surrendering earlier gains. AUD/NZD gyrated similarly with Australian Dollar bulls reversing initial weakness versus the Kiwi. That all said, is there potential for Australian Dollar strength to broadly resume in the week ahead?

AUD/USD PRICE CHART: DAILY TIME FRAME (06 NOV 2020 TO 19 MAR 2021)
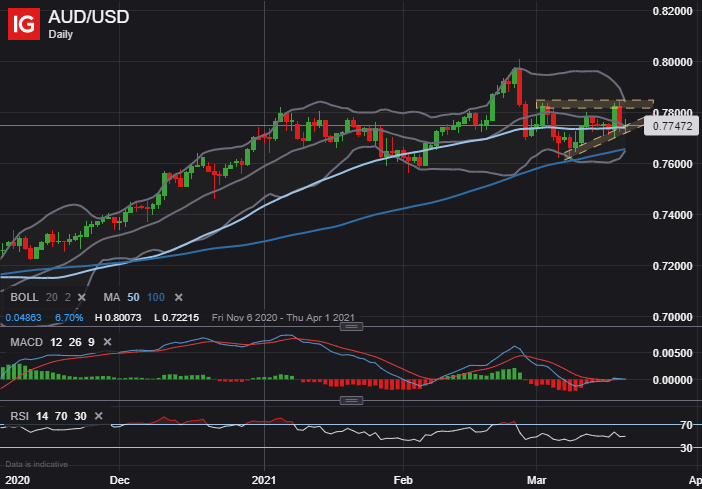
AUD/USD price action found support around its 100-day simple moving average earlier this month and has formed a string of higher lows ever since. The Australian Dollar continues to face pushback near the 0.7830-price level, however, and may struggle to reclaim this technical resistance level. This brings focus to the potential formation of a bullish ascending triangle pattern.
| Change in | Longs | Shorts | OI |
| Daily | -2% | -18% | -5% |
| Weekly | 13% | -23% | 4% |
Australian Dollar bulls might look to keep AUD/USD price action afloat above its 50-day simple moving average. Breaching this area of buoyancy could motivate AUD/USD bears to make a push toward its bottom Bollinger Band. To that end, failure to surmount and flatten out the downward-sloping 20-day simple moving average may see AUD/USD gravitate lower.
AUD/JPY PRICE CHART: DAILY TIME FRAME (06 NOV 2020 TO 19 MAR 2021)

AUD/JPY price action pulled back from a fresh 37-month high late last week to test prior resistance-turned-support. This area around the 84.00-handle is roughly highlighted by the 24 February close. The 20-day simple moving average, which broadly underpins the bullish trend propelling AUD/JPY higher for most of the year, adds another layer of defense to this potential zone of confluent support.
| Change in | Longs | Shorts | OI |
| Daily | -38% | -12% | -21% |
| Weekly | -13% | -18% | -17% |
Australian Dollar bulls have struggled to maintain upward momentum, however. This is emphasized by bearish divergence on the relative strength index. Not to mention, the latest wave of AUD/JPY weakness has coincided with a bearish MACD crossover. A breakdown below the 20-day simple moving average could bring the 82.00-price level into focus for AUD/JPY bears. Nonetheless, the direction of the Australian Dollar likely hinges broadly on the ebb and flow of market sentiment.
AUD/NZD PRICE CHART: DAILY TIME FRAME (31 JUL 2020 TO 19 MAR 2021)
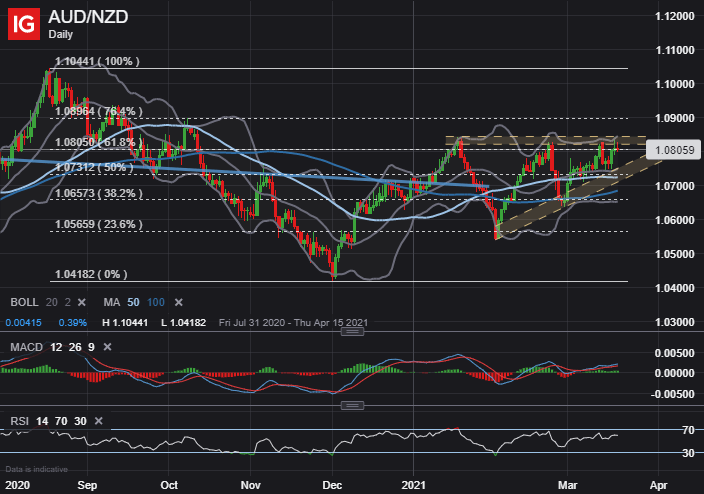
AUD/NZD price action faced selling pressure early last week, but Australian Dollar bulls stepped in around the 20-day simple moving average and sent the currency pair rebounding back higher. The Aussie-Kiwi continues to contend with a key technical obstacle, however, underscored by the 1.08-level and year-to-date highs. This area also aligns with the 61.8% Fibonacci retracement level of last year’s bearish leg.

Topping the 19 January high on a closing basis could clear the way for AUD/NZD to extend its climb toward the 1.0900-mark as this might indicate a breakout from the ascending triangle pattern. On the other hand, another rejection of this technical resistance level might see AUD/NZD snap back lower to test last week’s lows. A heartier push by Australian Dollar bears below the 50-day moving average could see the 26 February close come into focus.
-- Written by Rich Dvorak, Analyst for DailyFX.com
Connect with @RichDvorakFX on Twitter for real-time market insight


