


Canadian Dollar Technical Forecast: Bearish
- AUD/CAD’s Descending Triangle back in play after prices climb from trendline
- NZD/CAD formed a Symmetrical Triangle pattern following a new lower high

AUD/CAD Technical Outlook
The Canadian Dollar wavered against the Australian Dollar following a worse-than-expected Canadian jobs report. AUD/CAD recorded a 0.44% gain on Friday. The pair briefly pierced above the lower bound of a Descending Triangle pattern before resistance at the 20-day Simple Moving Average (SMA) and the 23.6% Fibonacci retracement level from the December – January move killed upside momentum.
The move higher was preceded by a selloff earlier in the week when prices made a bearish break below the triangle’s support level. A rising trendline formed from last October’s swing low along with confluent support in the form of the 50-day SMA stifled downside momentum, which then helped guide action higher.
With prices trading within the triangle pattern once again, its upper and lower bounds may offer resistance and support going forward. A move lower would see the 50-day SMA shift back into focus in company with the previously mentioned support level. To the upside, the triangle’s descending upper bound stands in the way of AUD/CAD resuming its broader uptrend, but prices would have to first clear the 20-day SMA to test resistance.
AUD/CAD 6-Hour Chart
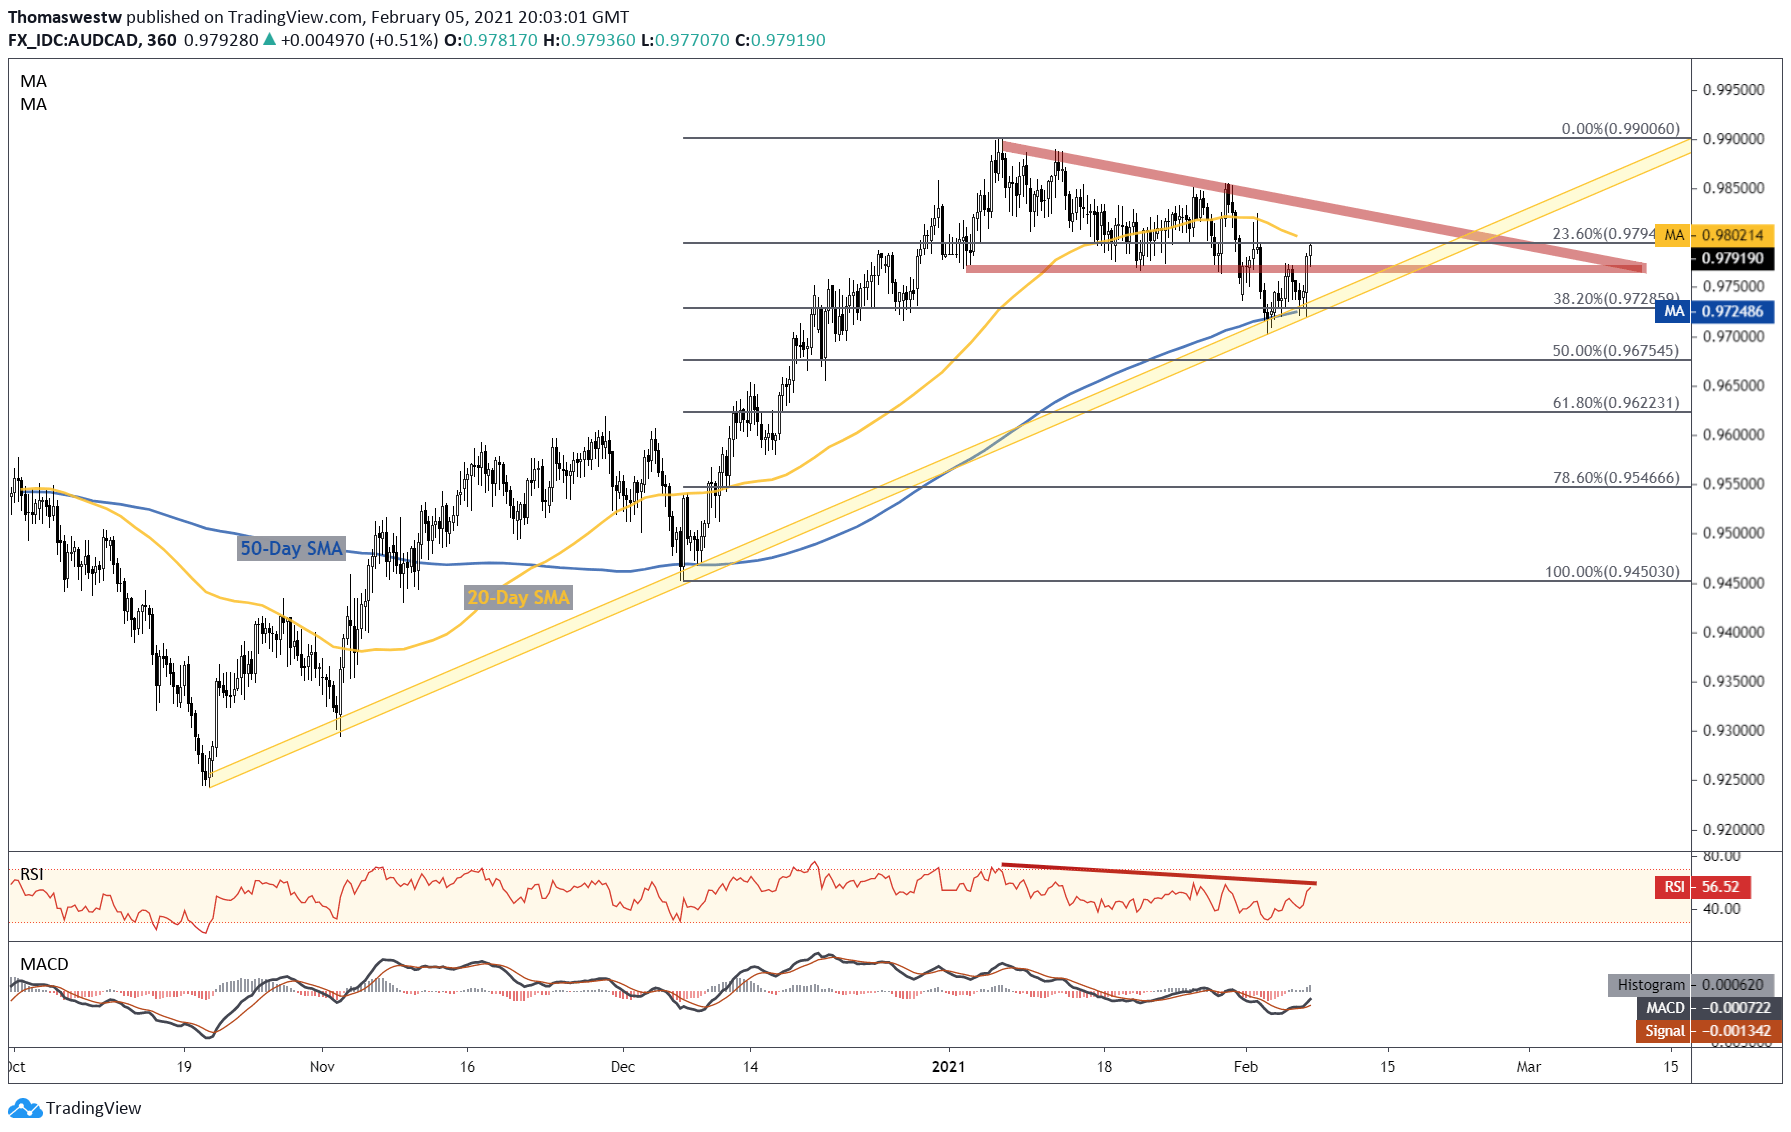
Chart created with TradingView
NZD/CAD Technical Outlook
The Canadian Dollar failed to perform against the New Zealand Dollar last week. A Symmetrical Triangle appears to be in the works after the cross made a lower high, forming the triangle’s descending trendline in the process. The 23.6% Fibonacci level – which sits slightly below the pattern’s apex – provided support after prices fell from resistance.
Looking ahead, prices may continue to range between support and resistance over the coming days. The Canadian Dollar’s current posture appears slightly disadvantaged against the Kiwi when considering the preceding trend higher along with support from the 23.6% Fib level. Breaking above resistance would open the door for the broader trend higher to resume. Alternatively, a breach below support would likely see prices accelerate lower.
NZD/CAD 6-Hour Chart
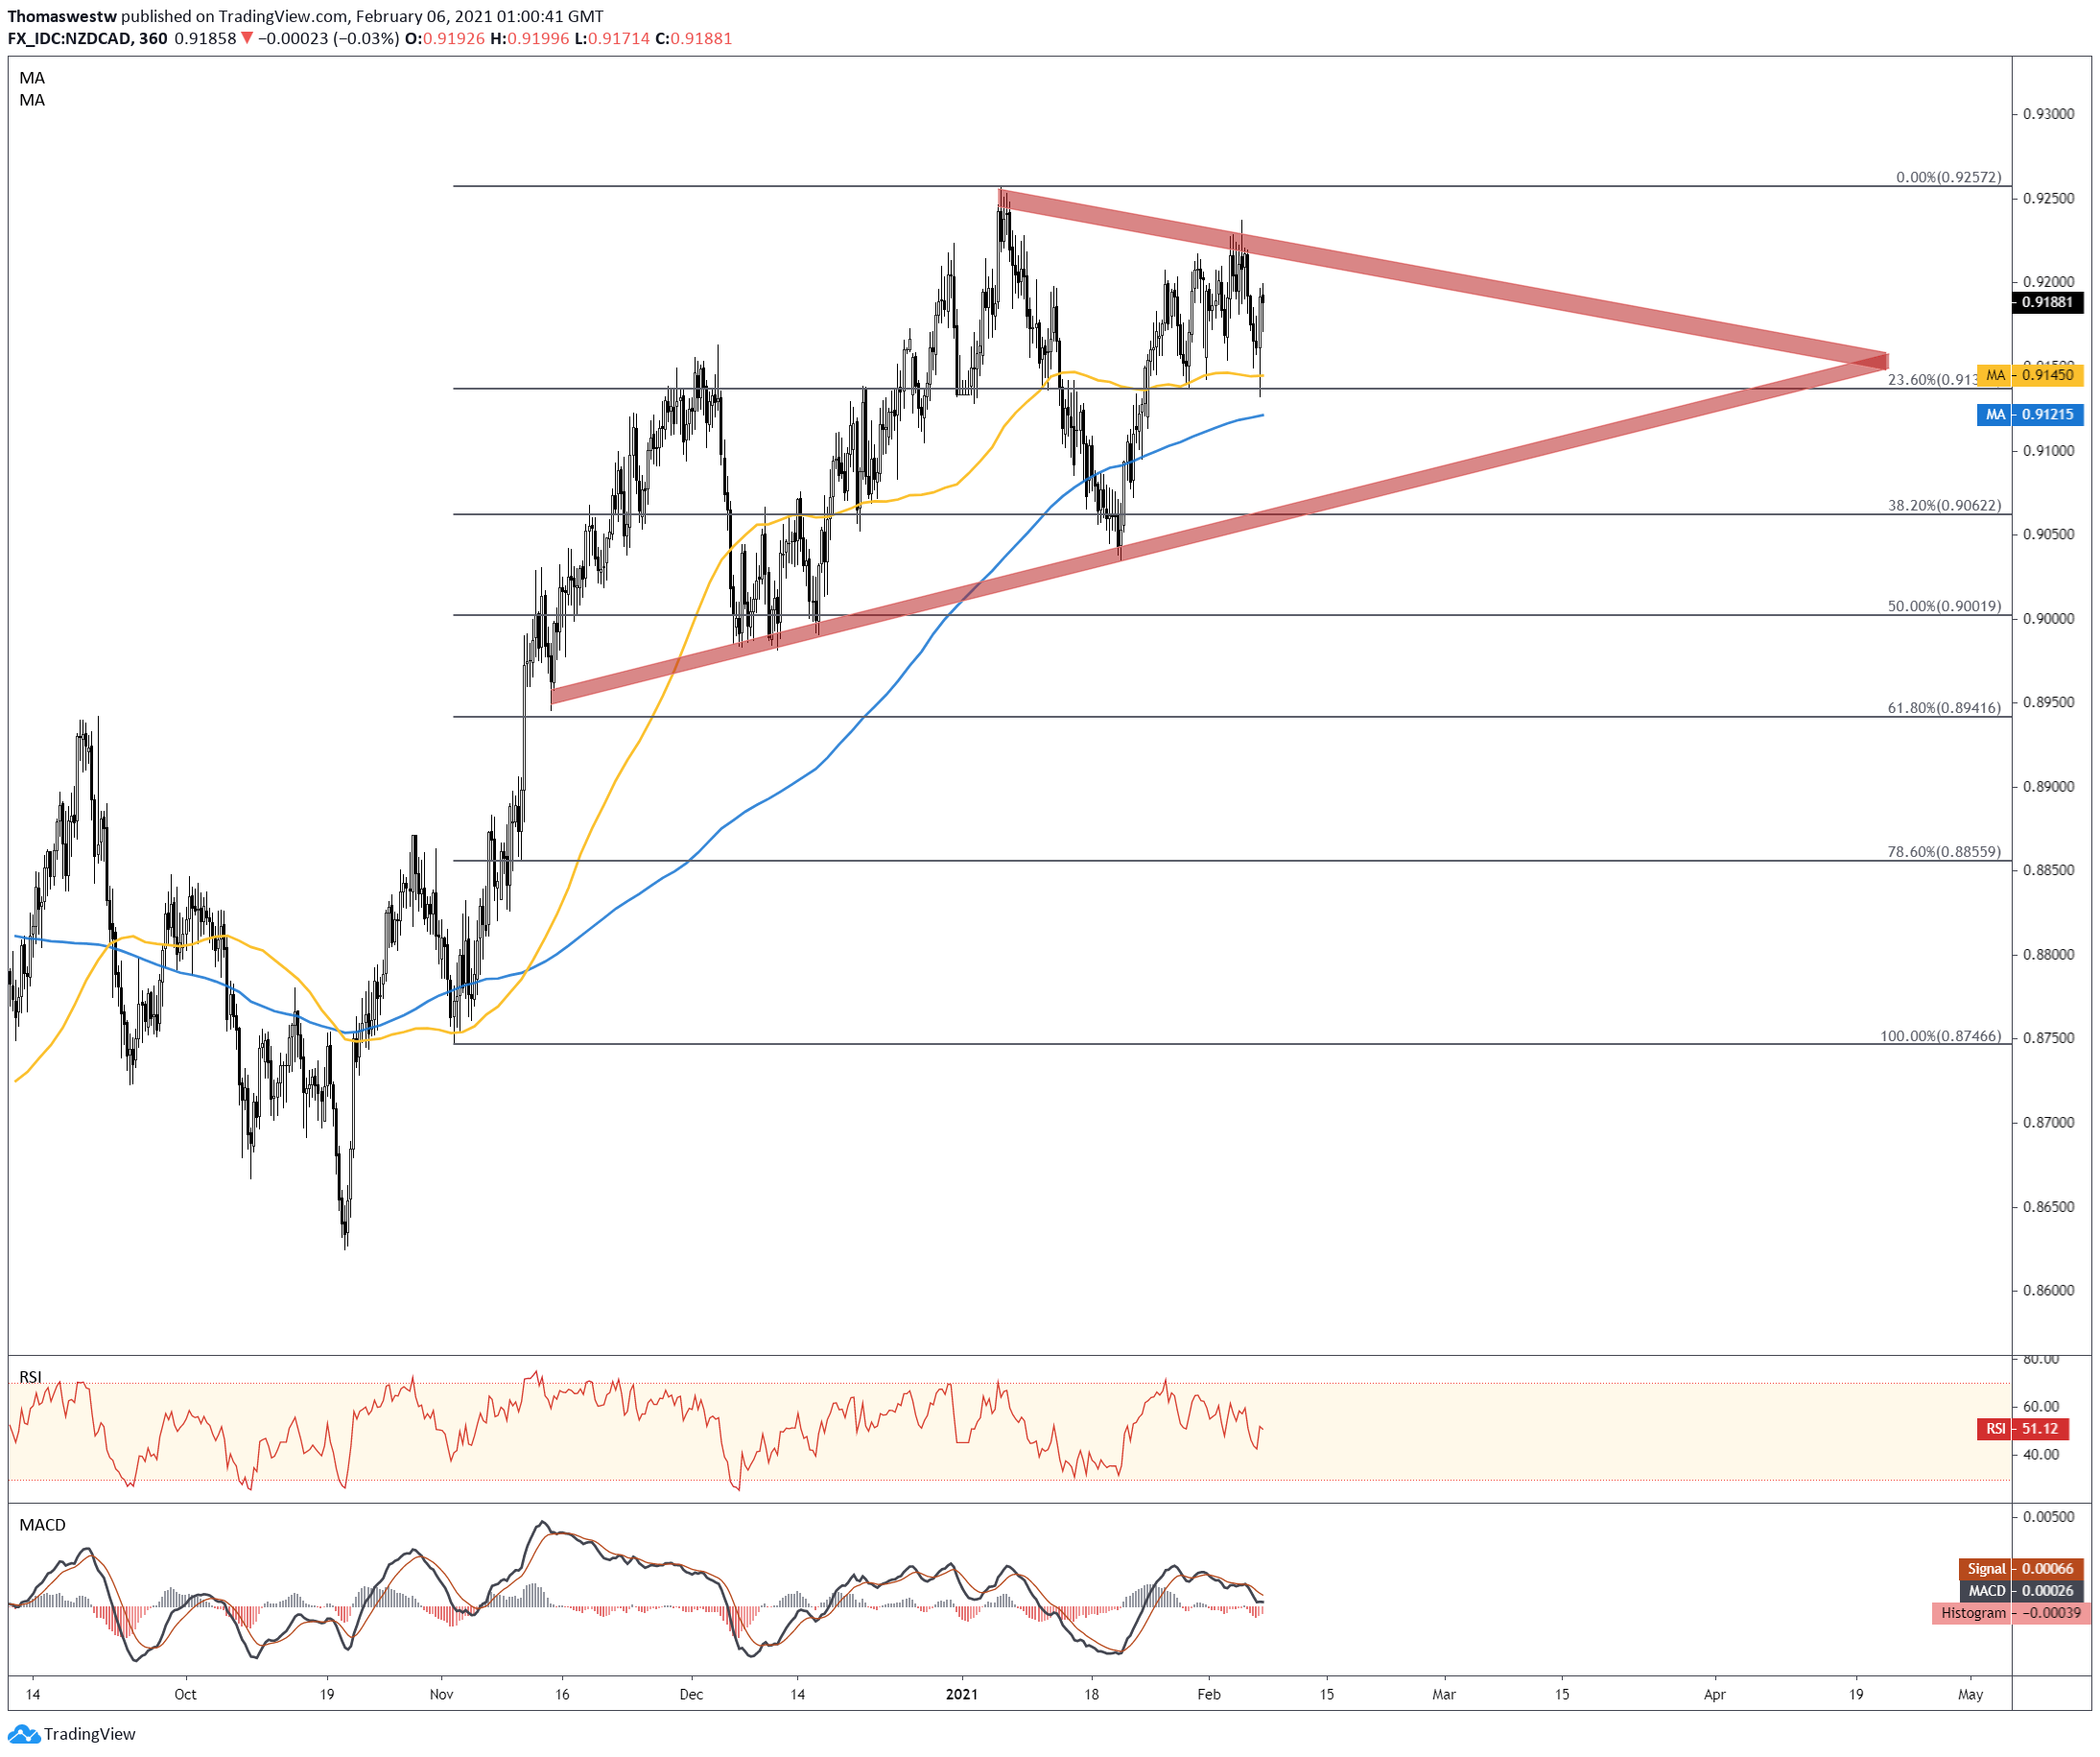
Chart created with TradingView
AUD/CAD, NZD/CAD TRADING RESOURCES
- Just getting started? See our beginners’ guide for FX traders
- What is your trading personality? Take our quiz to find out
- Join a free webinar and have your trading questions answered
--- Written by Thomas Westwater, Analyst for DailyFX.com
To contact Thomas, use the comments section below or @FxWestwater on Twitter


