


US DOLLAR WEEKLY TECHNICAL FORECAST – BULLISH
- US Dollar selling pressure subsided last week as Treasury yields surged
- EUR/USD price action whipsawed lower and breached trend support
- GBP/USD notched a string of lower highs and bearish MACD crossover
The US Dollar edged slightly higher this past week with the DXY Index eking out a modest 0.2% gain. US Dollar weakness appeared to wane broadly alongside surging Treasury yields. EUR/USD failed to maintain altitude after printing a close above the 1.2300-price level and GBP/USD has been consolidating lower. This brings to focus US Dollar rebound potential off two-year lows.
DXY – US DOLLAR INDEX PRICE CHART: WEEKLY TIME FRAME (NOV 2019 TO JAN 2021)

Chart by @RichDvorakFX created using TradingView
US Dollar bears pushed the DXY Index to its weakest level since March 2018 headed into the Georgia senate runoff election, but once the 10-year Treasury yield eclipsed the 1.00% level on prospects of a democratic sweep, the Greenback whipsawed broadly higher and finished positive on the week. Though it may be premature to call a bottom, the US Dollar does look quite oversold and might be primed for a relief bounce within the confines of its apparent falling wedge pattern. Taking out last week’s low could undermine the US Dollar rebound attempt and expose the 88.20-price level where the DXY Index bottomed nearly three years ago.
{{GUDIE|FOREX_FOR_BEGINNERS}}
EUR/USD PRICE CHART: DAILY TIME FRAME (10 OCT 2020 TO 08 JAN 2021)
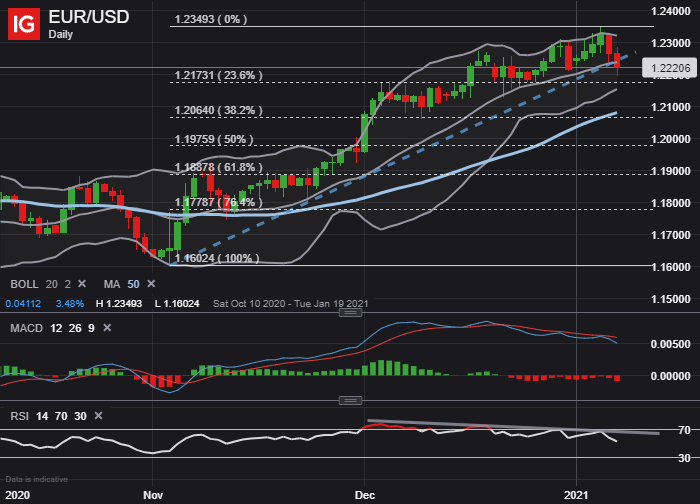
EUR/USD pullback potential is underscored by the major currency pair breaching its bullish trendline extended from the 03 November and 23 November swing lows. Negative divergence on the relative strength index also highlights waning upward momentum as EUR/USD price action recoils lower from the 1.2300-level. The 23.6% Fibonacci retracement level outlined on the chart above stands out as a possible area of buoyancy before a test of the 50-day simple moving average comes into consideration. Reclaiming the 20-day simple moving average could reinvigorate EUR/USD bulls to have another look at recent highs, however.
| Change in | Longs | Shorts | OI |
| Daily | 0% | -10% | -4% |
| Weekly | -5% | 1% | -3% |
GBP/USD PRICE CHART: DAILY TIME FRAME (10 OCTG 2020 TO 08 JAN 2021)
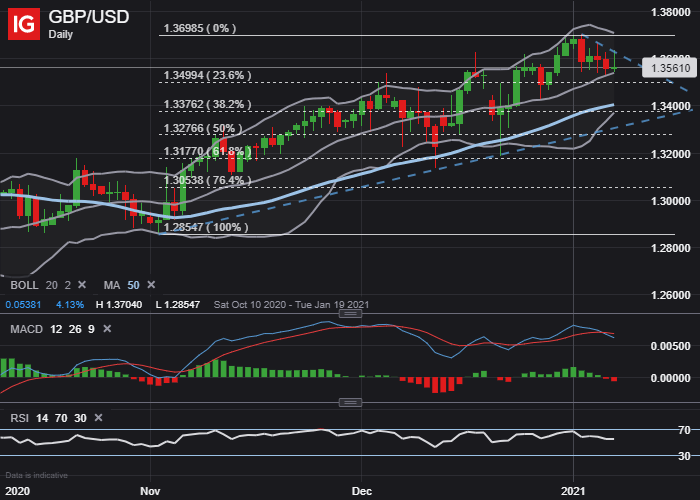
GBP/USD has drifted and recorded a series of lower highs since the start of the year. This forged a bearish MACD crossover on a daily chart. The contracting Bollinger Band width further suggests the Pound-Dollar might be in consolidation mode. Breaching the 20-day simple moving average might motivate GBP/USD bears to make a deeper push toward the 1.3400-price level. This potential technical support zone is underpinned by a confluence of the 50-day simple moving average, bottom Bollinger Band, and 38.2% Fibonacci retracement of the rally off November’s swing low. On the other hand, if GBP/USD price action surmounts its short-term bearish trendline, there could be a resumption of US Dollar weakness.
-- Written by Rich Dvorak, Analyst for DailyFX.com
Connect with @RichDvorakFX on Twitter for real-time market insight


